View Service Details
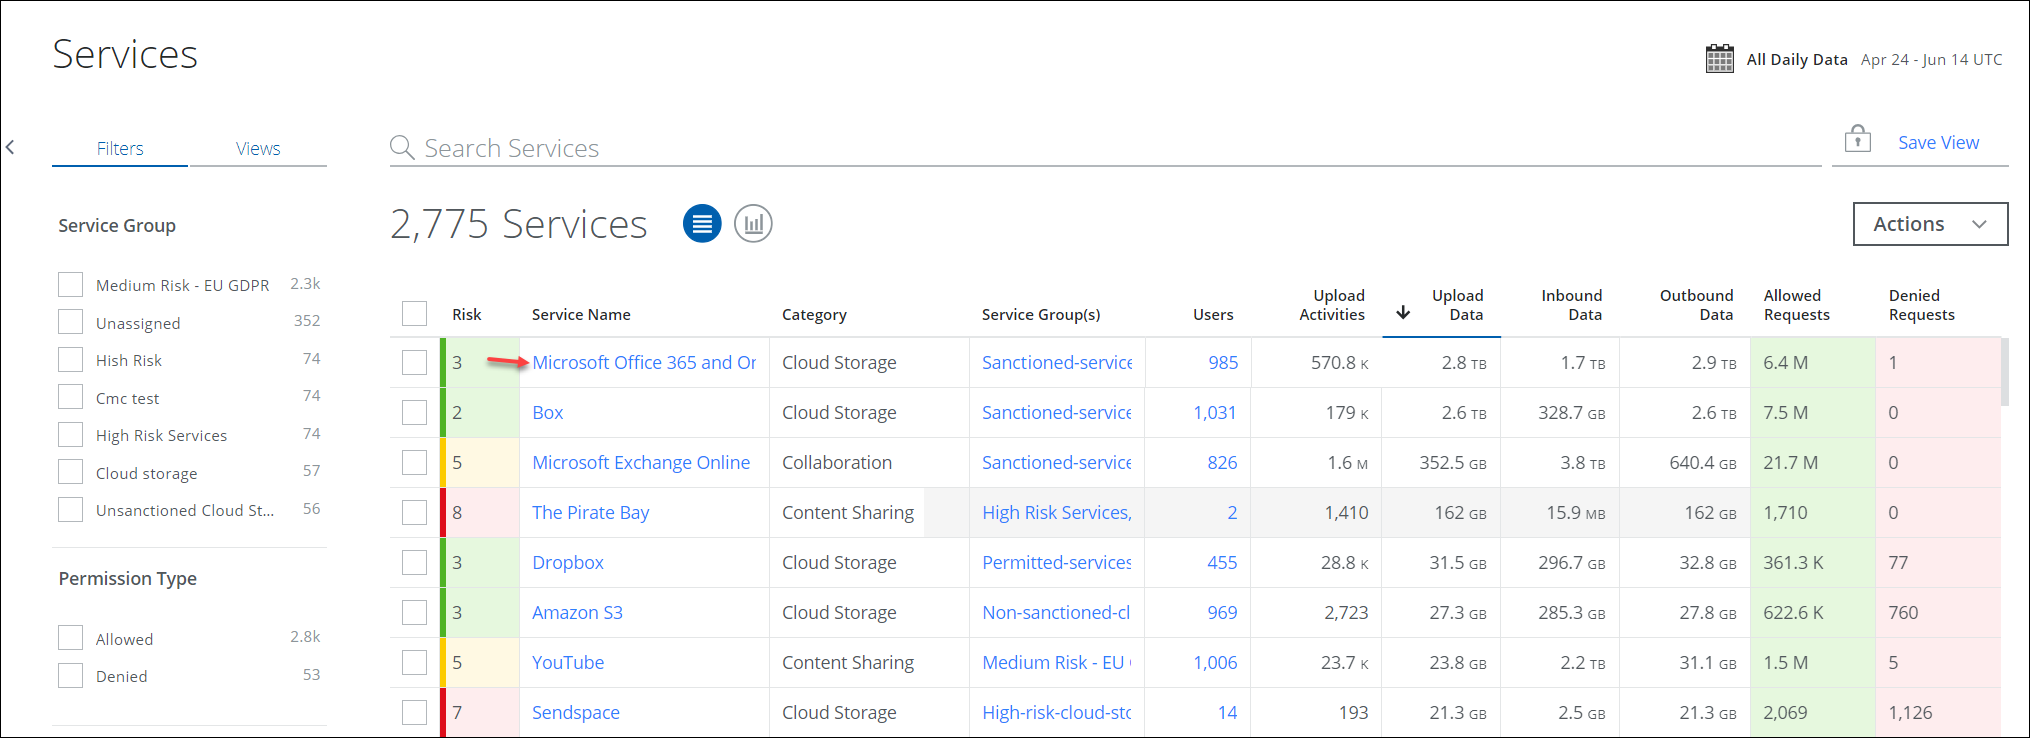
The Service details page provides the details of Cloud Service, usage metrics, hosting locations, risk score associated with your cloud service and displays the total amount of data allowed or denied by the firewall and proxy. It allows users to take the required actions depending on the specified result.
You can access the Service Details page from these different pages:
- Analytics > Services
- Analytics > Connected Apps
- Governance > Cloud Registry
From each page, select a Service from the table under Service Name.
The Service Details page provides specific information for each Cloud Service on four tabs:
- Overview
- Risk
- Usage
- Traffic
NOTES:
- If the Service is not currently used by the tenant, only the Overview and Risk tabs are available.
- For sanctioned services, click any of the following API status icons next to the Service Name to view the list of sanctioned services that are supported for API integration. For details, see Manage Sanctioned Services via Skyhigh CASB.
The page also provides the following actions on all tabs:
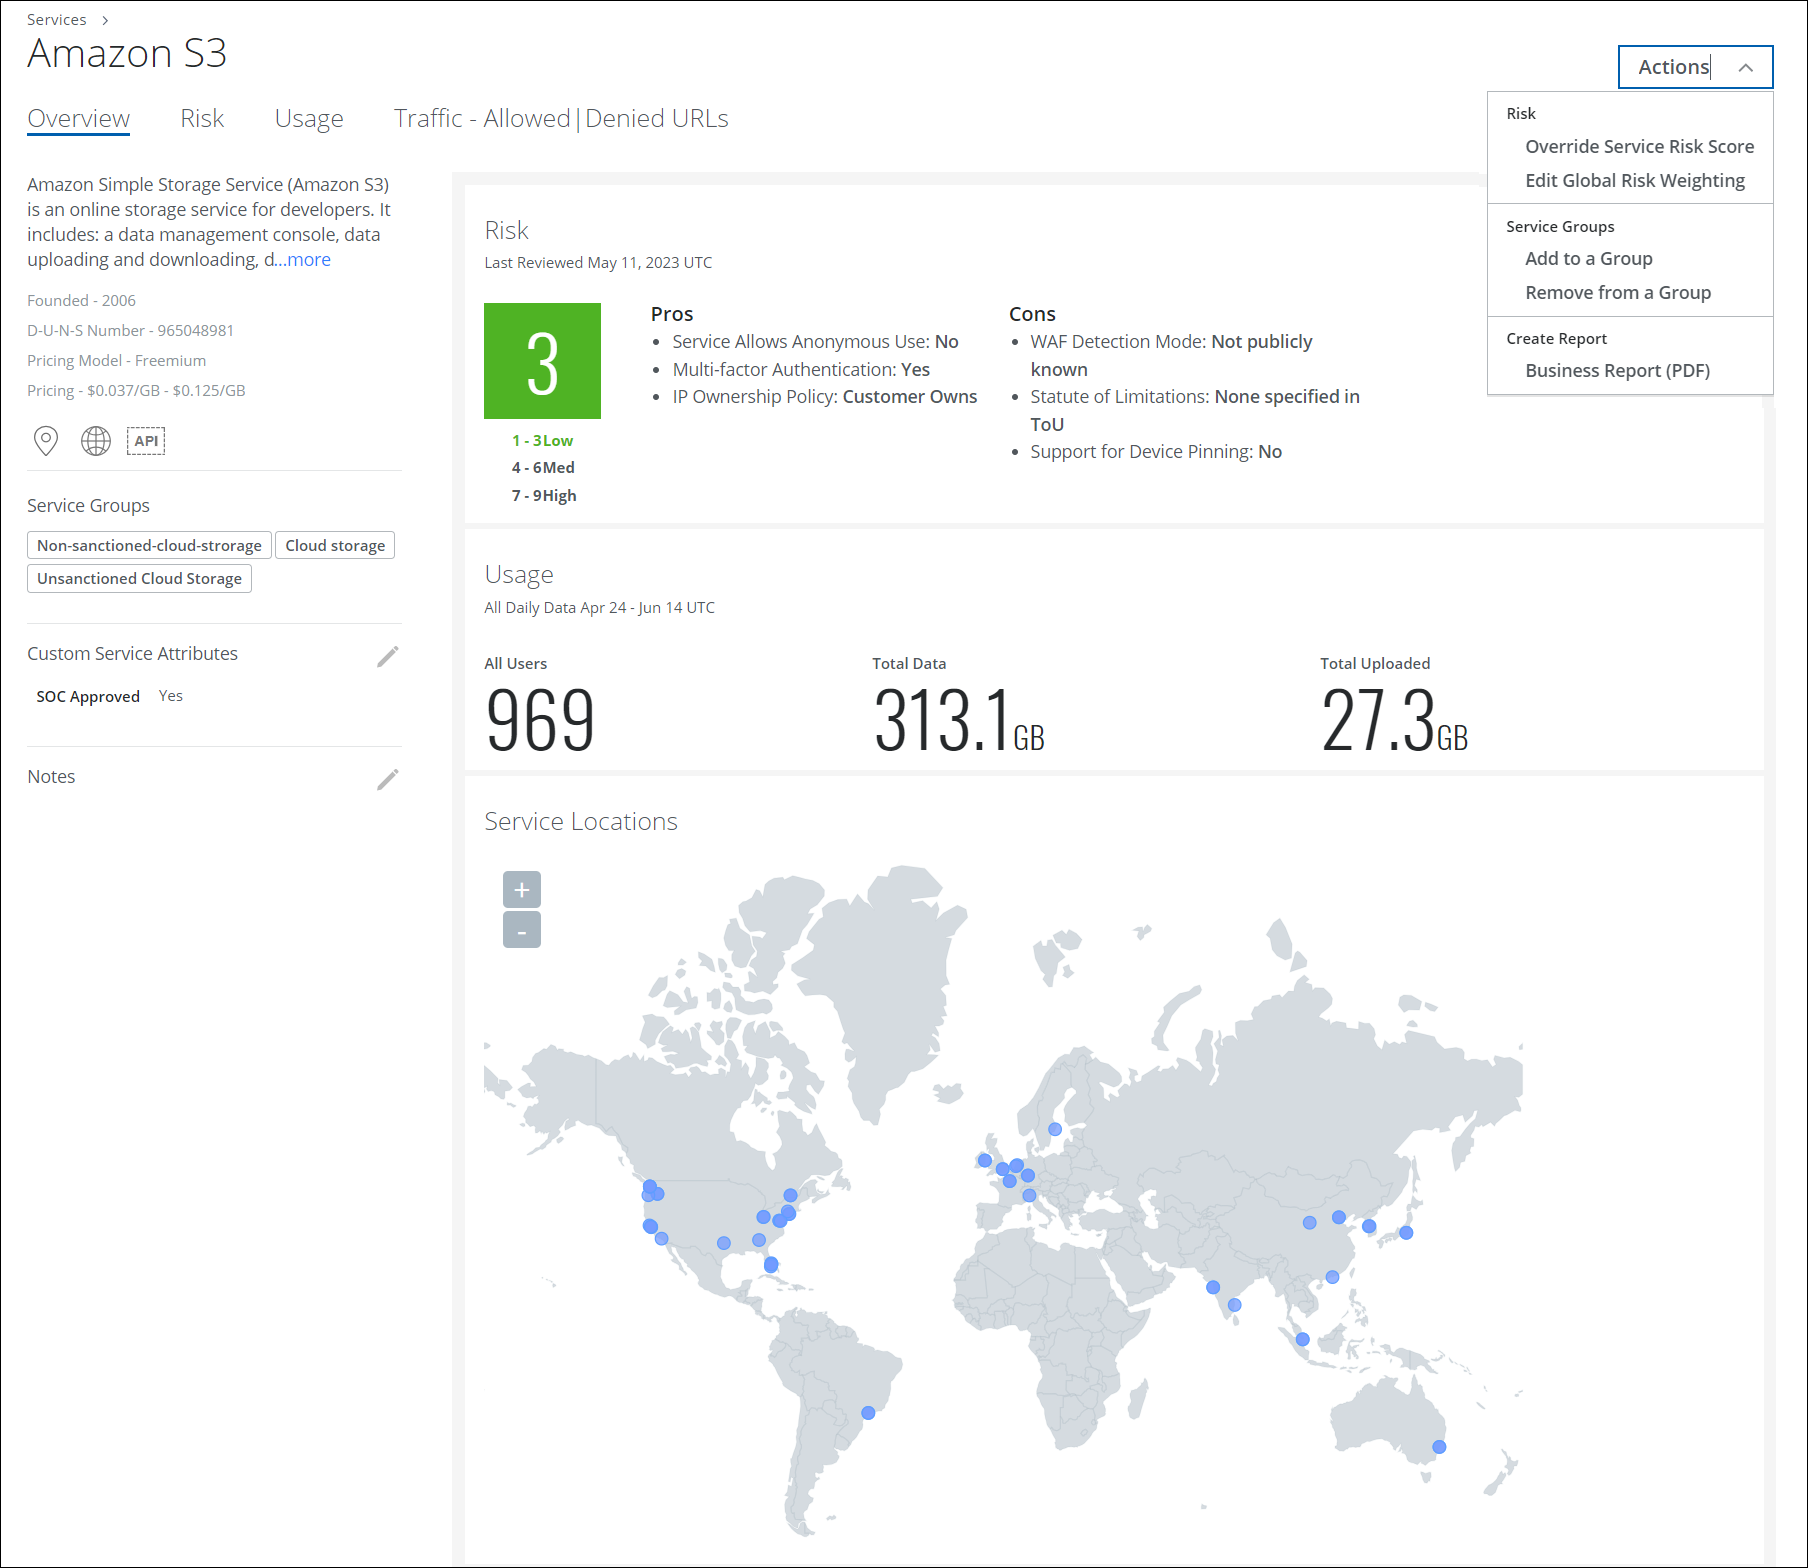
- Actions: Click Actions to:
- Risk
- Service Groups
- Create Report
- Business Report (PDF). Automatically creates a PDF report for all Service Details and emails it to the logged in user.
Overview Tab
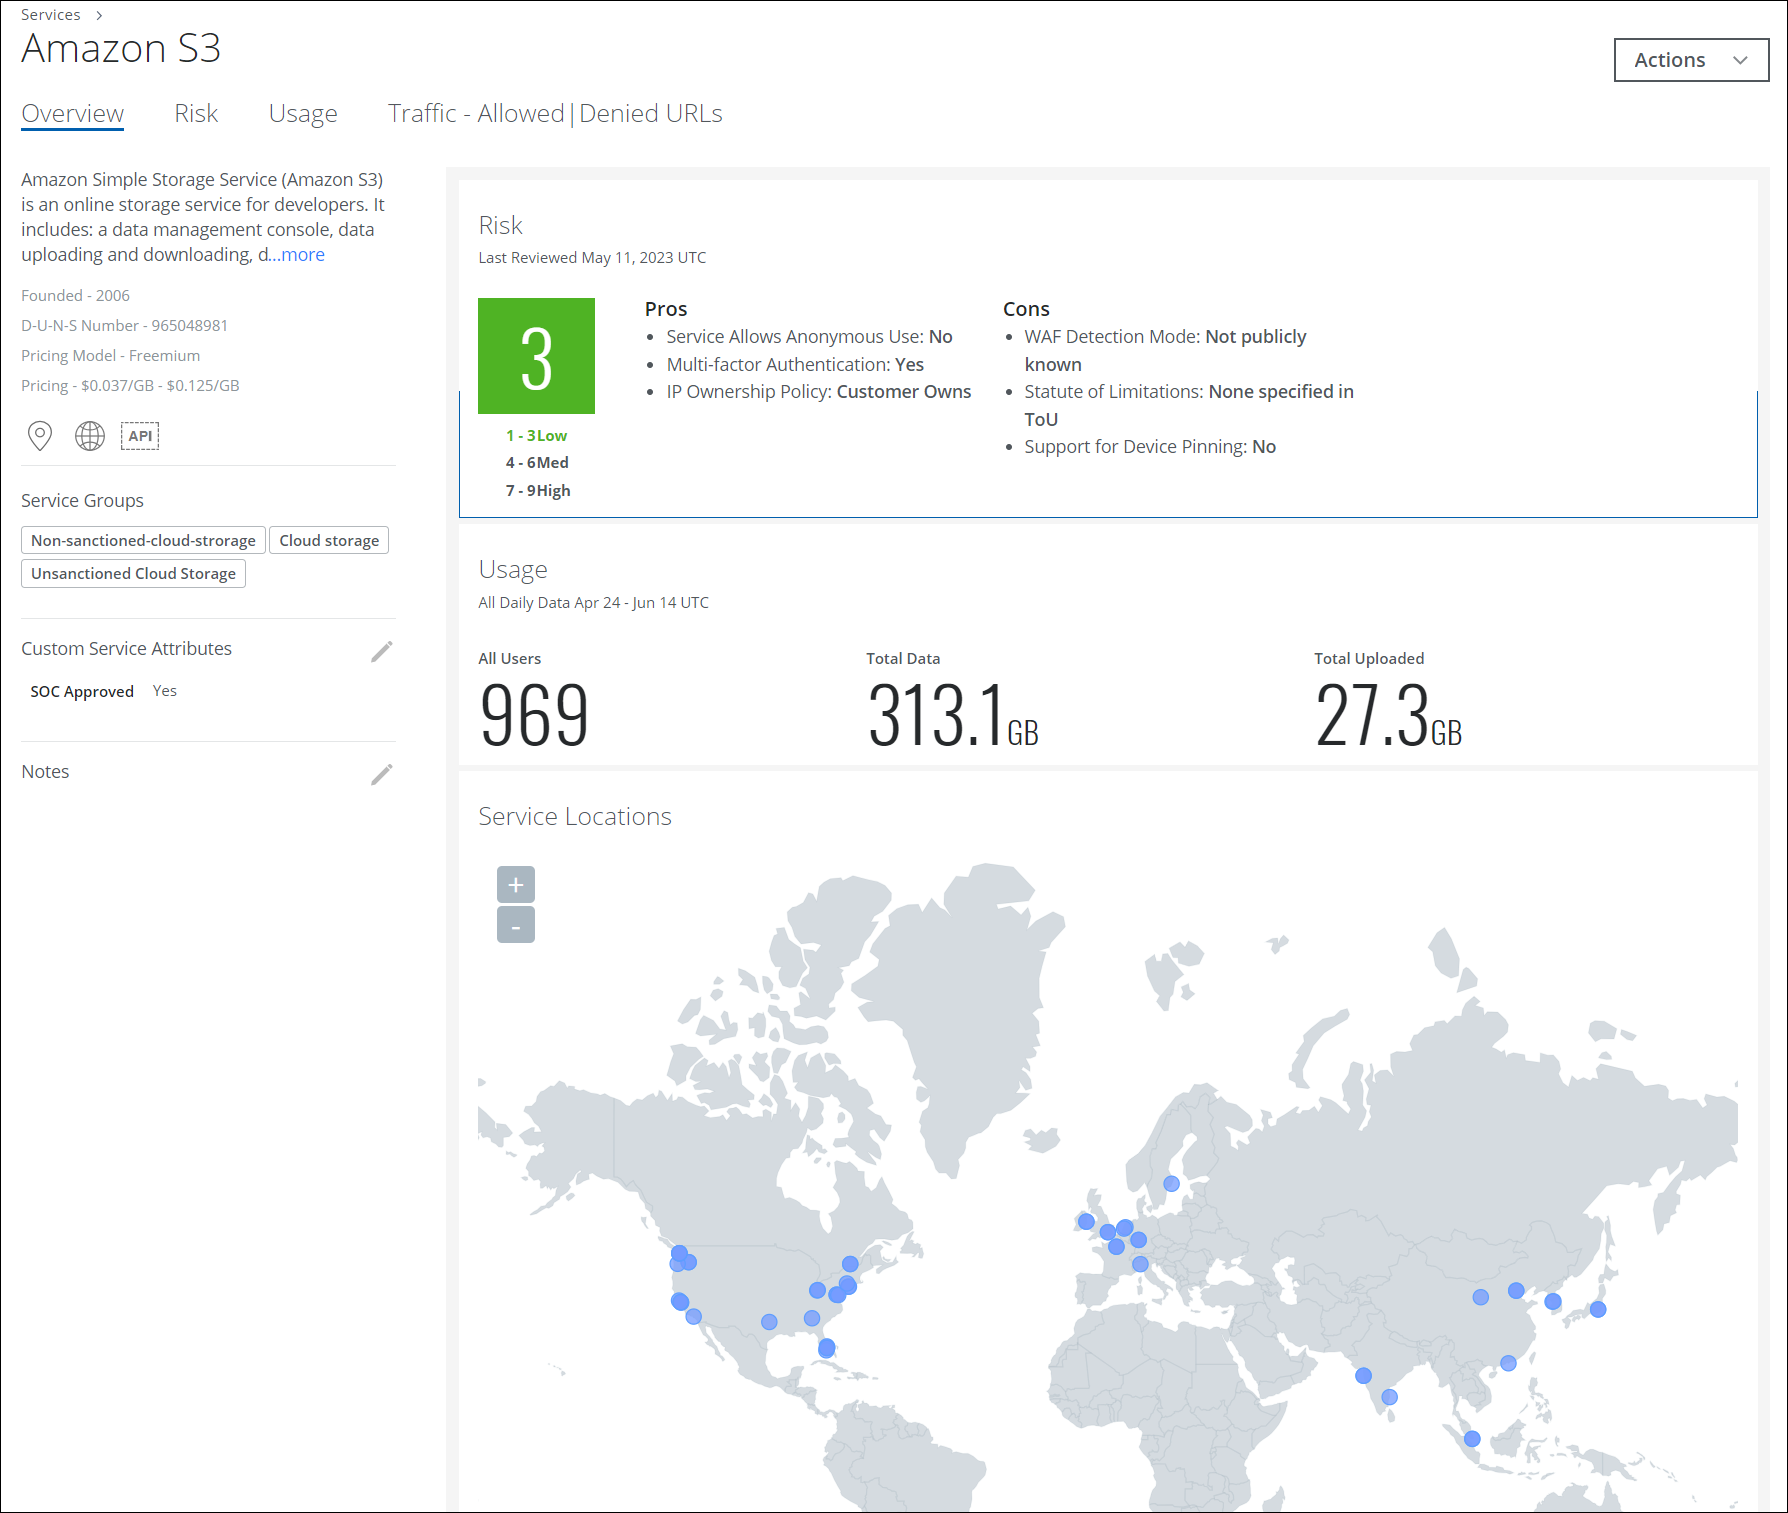
The Service Detail Overview tab provides general information about the Cloud Service, usage metrics, and hosting locations, including:
- Description. A basic description of the Cloud Service including links to the company address, URL, and API information.
- D-U-N-S Number. A unique nine-digit number identifier for a cloud service providers' business headquarters assigned by Dun & Bradstreet.
NOTE: Currently, not all CSPs have a D-U-N-S number, as they are still being added.
- Custom Service Attributes. Lists the Custom Service Attributes defined for this service by you. Click the pencil icon to create or edit Custom Service Attribute Values.
- Notes. Any notes from your team. Click the pencil icon to add notes.
- Risk. The default Risk Score provided by Skyhigh CASB, including Pros and Cons at a glance, is based on Cloud Registry Risk Attribute values and scored from 1 to 9. Green is Low (1-3), Yellow is Medium (4-6), and Red is High (7-9). Click to go to the Risk tab for this service.
- Usage. Includes metrics on All Users, Total Data, and Total Uploaded. Click to go to the Usage tab for this service.
- Service Locations. Displays a map of the world denoting the location of the service.
Risk Tab
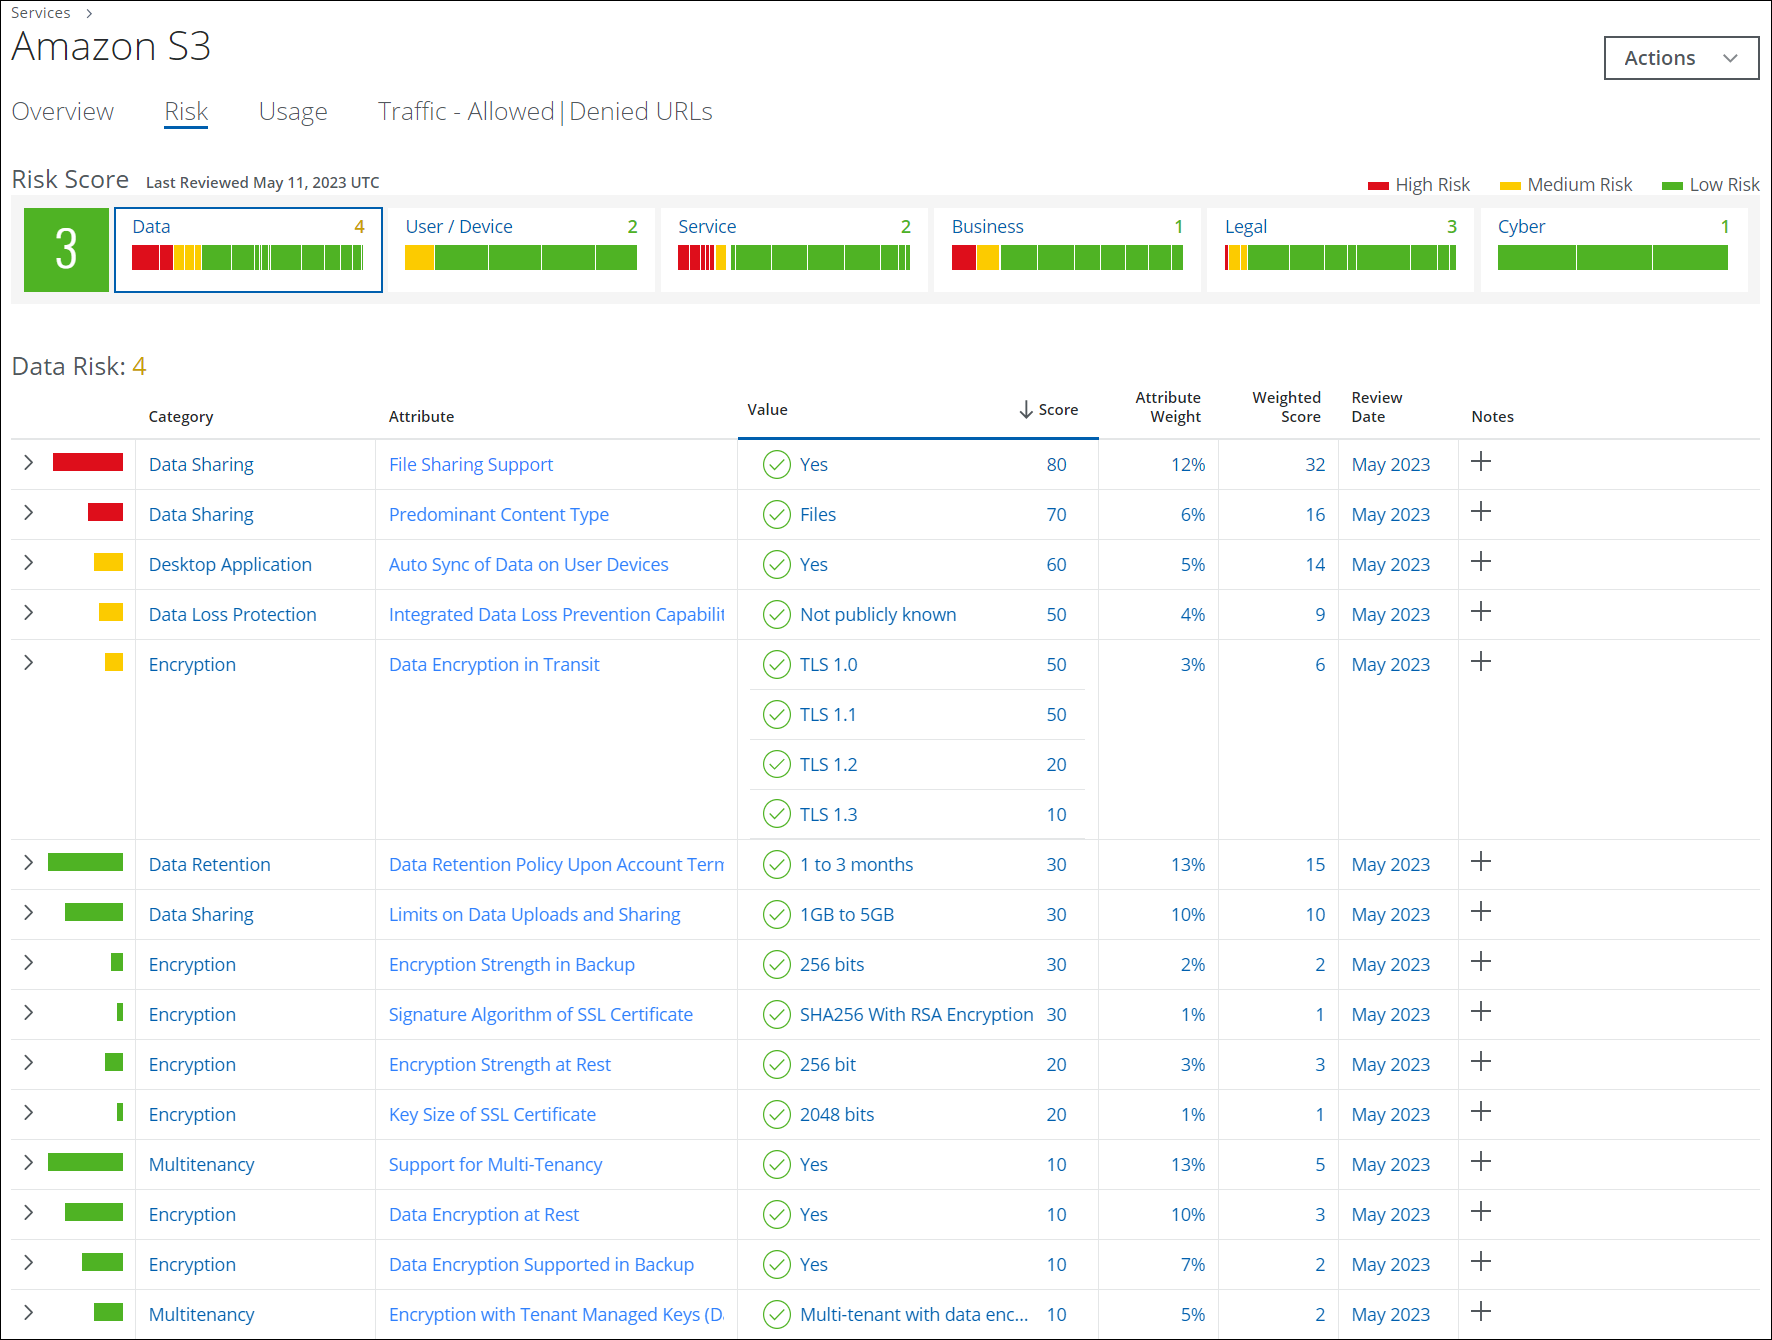
The Risk tab provides details about metrics on usage within your company, including:
- Click each Risk Score graph to sort the table by category. The Risk tab displays specific details about 66 Risk Attributes associated with the cloud service for each category:
- The table displays the following sortable columns:
- Score by color. The current Service Risk Score by color. Green is Low (1-3), Yellow is Medium (4-6), and Red is High (7-9).
- Category. The Risk Attribute category.
- Attribute. The Risk Attribute. Hover over the link for a detailed description of the attribute.
- Value and Score. The Value and Score are detailed in Risk Attributes.
- Attribute Weight. The current Attribute Weight. Go to Actions > Edit Global Risk Weighting to customize the weight.
- Weighted Score. The weighted score for this attribute.
- Review Date. The date the score was last reviewed.
- Notes. Any notes from your team. Click the plus icon to add notes.
Usage Tab
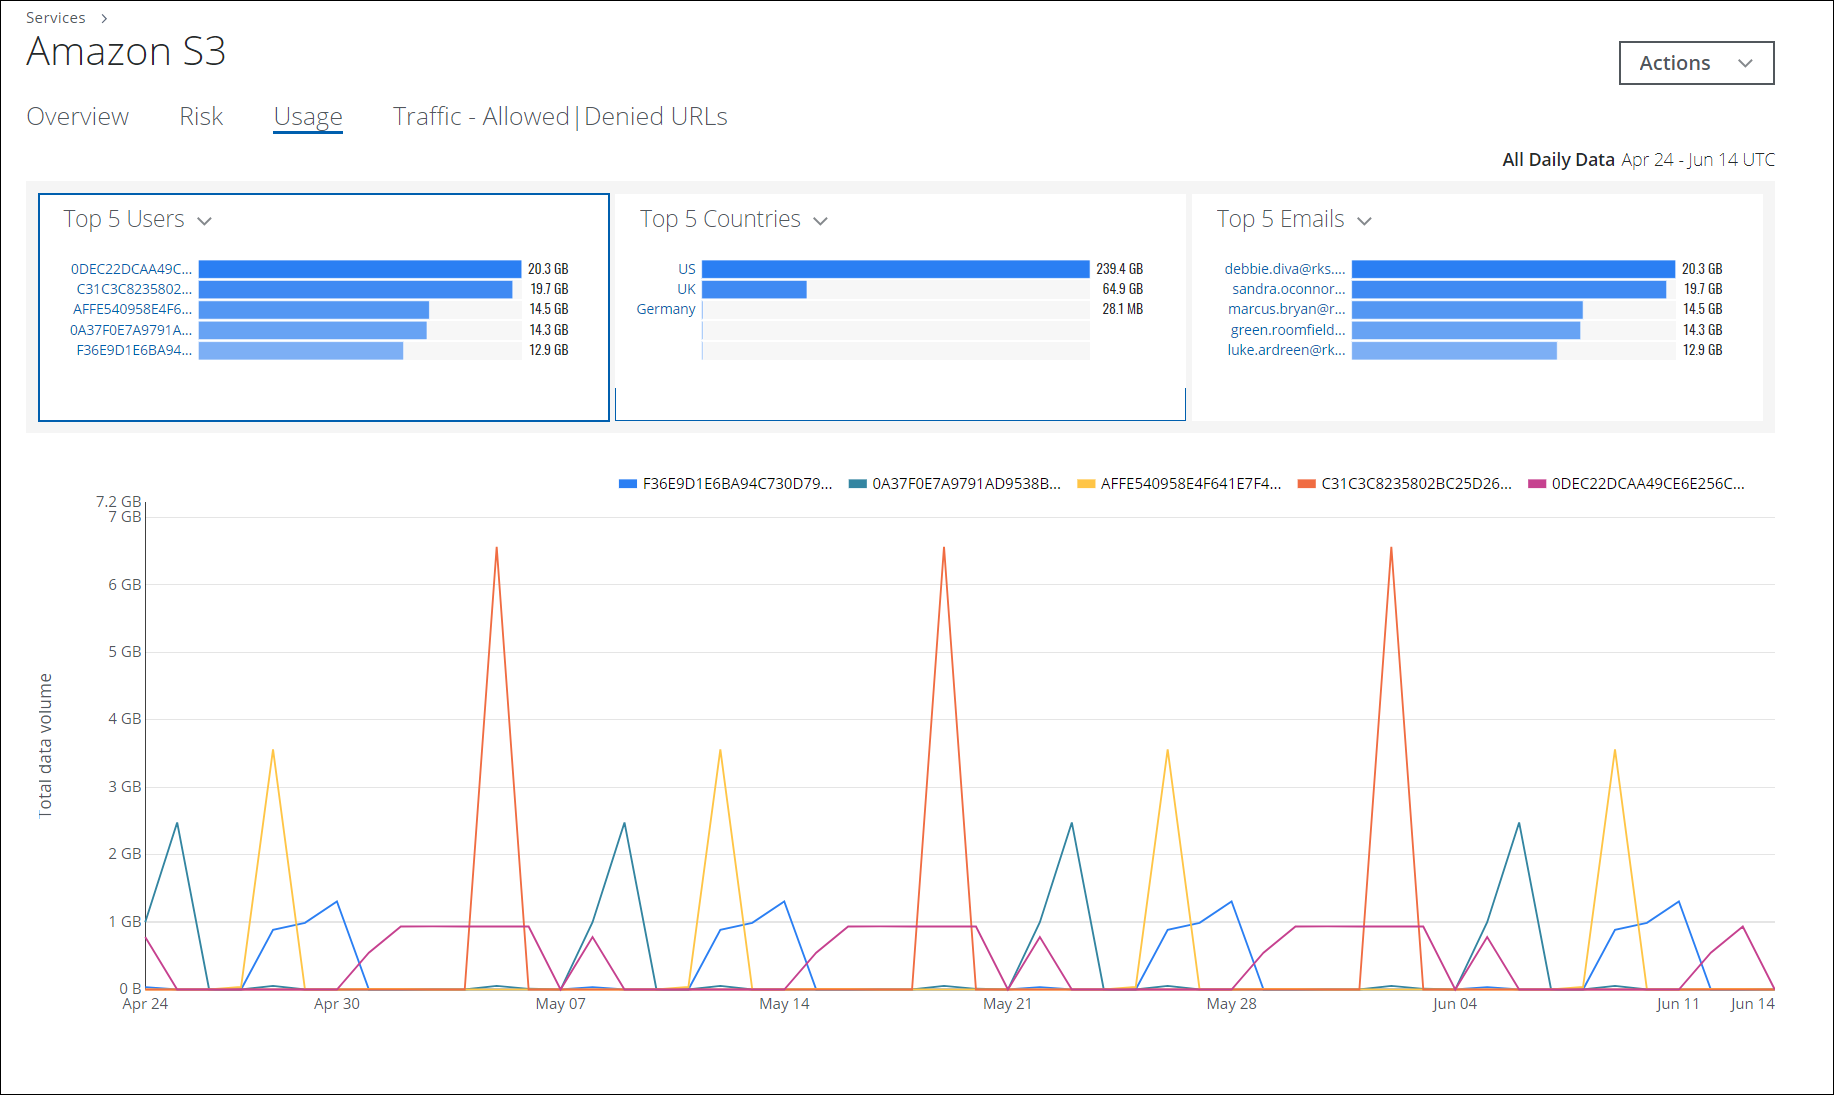
The Usage tab provides details about metrics on usage within your company, including:
- Top 5 Users. Click the graph to display details about the Total Data Volume in the chart below.
- Top 5 <against mapped AD attribute-1> (for example, User Names). Click the graph to display details about the Total Data Volume in the chart below.
- Top 5 <against mapped AD attribute-1> (for example, Countries). Click the graph to display details about the Total Data Volume in the chart below.
Interact with data in the chart by hovering your mouse over the timeline to display details.
Traffic Tab
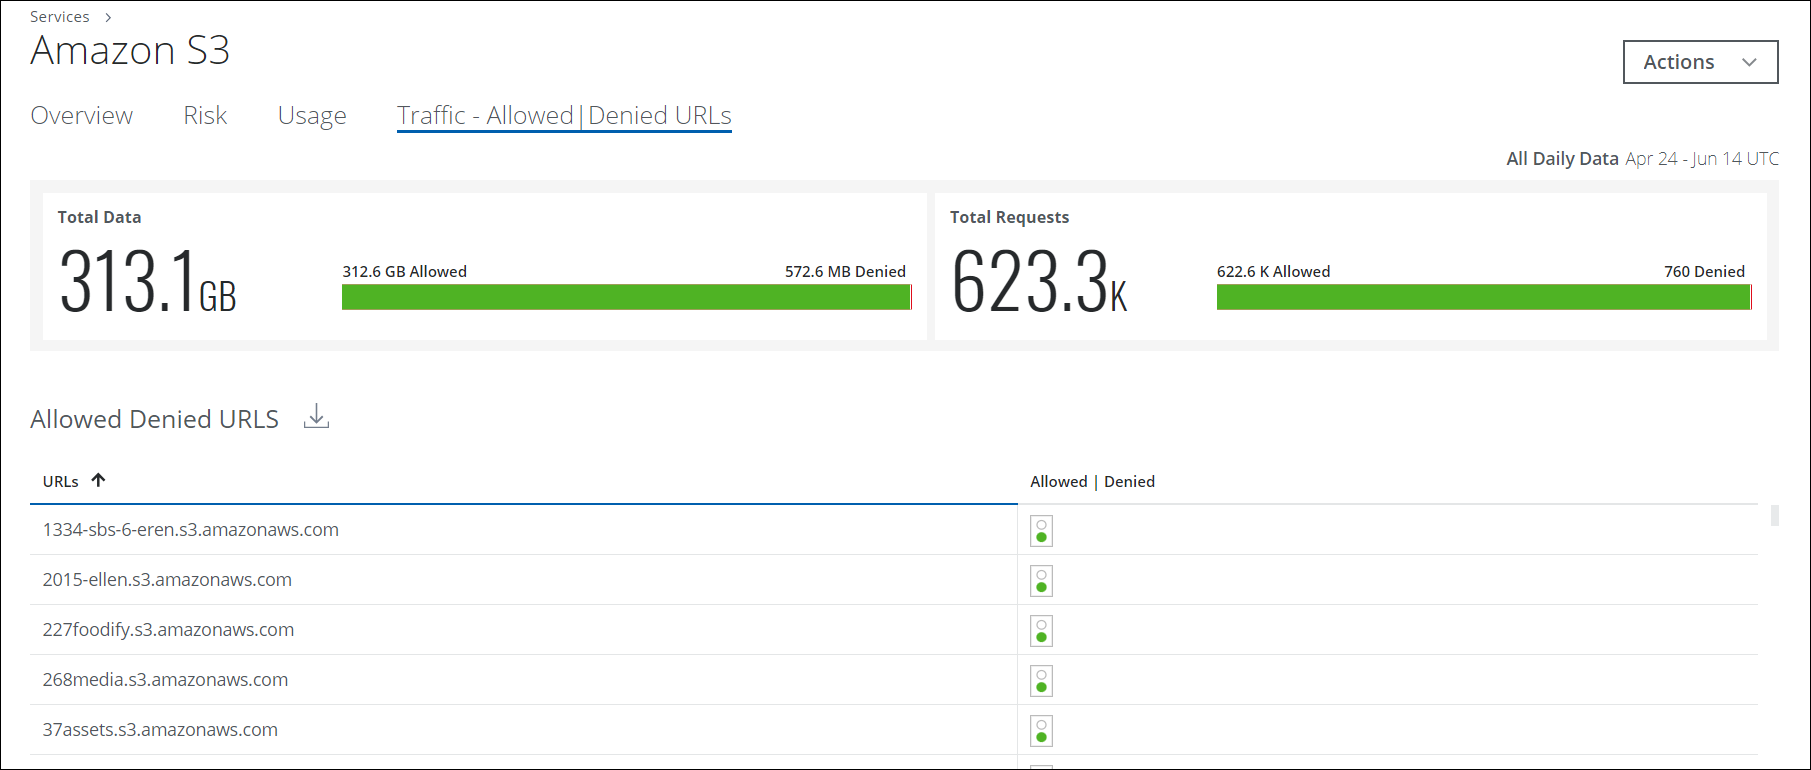
The Traffic tab provides details about which URLs your firewall or proxy allows and denies, including:
- Total Data. Displays the metric on the total amount of data allowed or denied.
- Total Requests. Displays the metric on total requests allowed or denied.
- Allowed Denied URLs. Displays the URLs and whether they are Allowed, Denied, or Both. To download allowed and denied URLs into an excel sheet, click the Download icon.