Policy Incidents Page
The Incidents > Policy Incidents page is a central repository of all incidents that have violated Policies. All Services are consolidated on this page, or you can choose to view the violations occurring in just one Service. You can display Policy Incidents data in a Table view, or create a Chart view. It also provides easy access to filters, Saved Views, and allows you to schedule a report, and display policy details with a single click.
To learn more about an incident, click to view Policy Incident Cloud Cards.
Table View
The Policy Incidents page Table view is the default view.
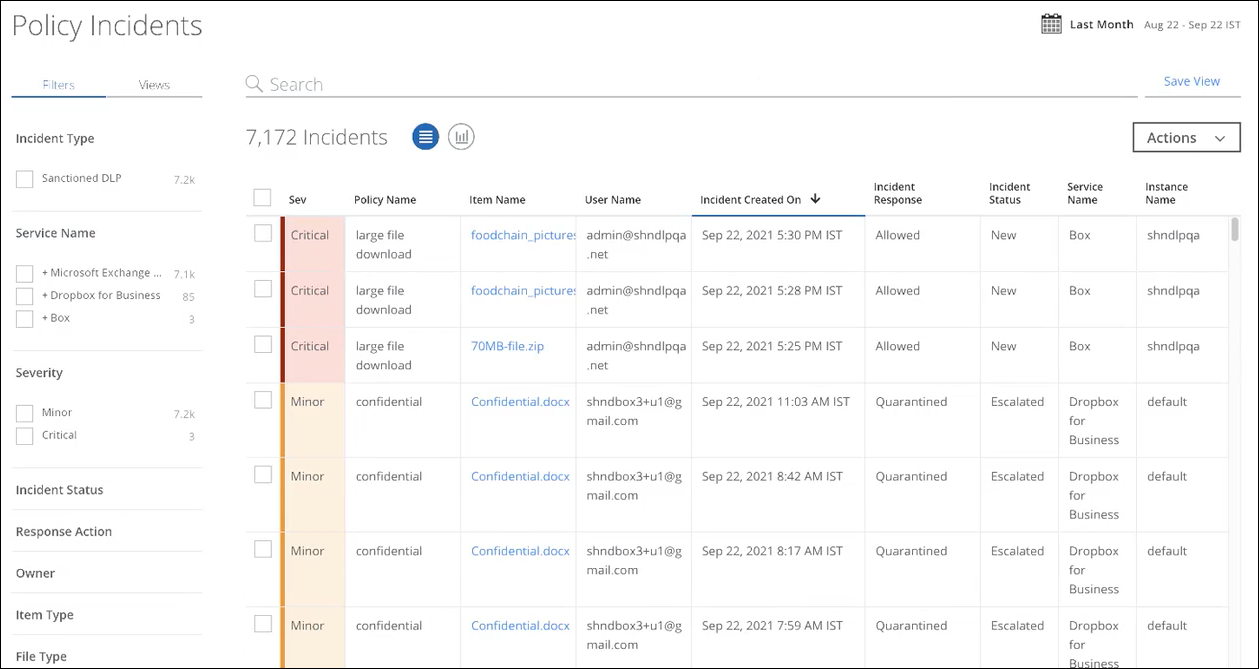
The Policy Incidents page provides the following information and actions:
- Search. Search via the Omnibar. You can search for multiple incident IDs by entering a comma-separated query in the Omnibar.
- Filters. Select options on the Filters tab to scope down your search.
- Views. Select the Views tab to use Saved Views created by you or shared with you by another user to reuse specified search parameters from a previous search on current data.
- Date Picker. Use the Date Picker to select a preset or custom date range to display data from only this date range.
- Save View. Click to create a Saved View from your search query.
- Actions. Click Actions to:
- Change Owner
- Change Status
- Delete Incidents. Select the checkboxes for incidents you want to delete. Then click Delete in the confirmation dialog. This action can't be undone. Large requests might take a few moments to process.
- Select Response
- Create Report
- Business Report (PDF). Create a PDF report and run it immediately, which then appears in the Report Manager.
- CSV. Create a CSV report and run it immediately, which then appears in the Report Manager.
- XLS. Create an XLS report and run it immediately, which then appears in the Report Manager.
- Schedule. Schedule a report to run later, which then appears in the Report Manager.
- Vulnerability Report. Generate a report for Container Incidents and Vulnerabilities. For details, see Report - Vulnerabilities.
- User Risk Report. Generate and download a User Risk Report to identify high, medium, and low-risk users for sanctioned services in your organization. You can generate or schedule a report, and access the generated reports via email or in the Report Manager.
NOTES:
- User Risk Report includes data from the last 100 days.
- You cannot view the Filters configured for the User Risk Report on the Schedule Report page.
Generate User Risk Report includes the following options:
- Generate Report. Click to generate a report. By default, the report is generated in the CSV file format. The report's title includes the report's name, current date, and time. For example, User Risk Report 10_09_23 1_56_50 PM UTC.
- Select your report format. Select CSV or XLSX file formats to generate a report.
- Schedule. (Optional) Schedule a report to run later, which then appears in the Report Manager.
An email is sent to the recipients with a link to download the report from Report Manager, and the report is attached if the size is less than 25 MB. The report includes user details such as username, user email, user risk score, number of incidents, threats, anomalies, activities, Active Directory (AD) attributes, and more.
- Settings
- Edit Table Columns. You can edit table columns and save your changes as a Saved View.
- Severity. Severity level of the incident: Critical, Major, Minor, Information, or Warning.
- Policy Name. The name of the policy was given when it was created.
- Item Name. Item or file that violated the policy. If a link is available, you can click to download it. For more information, see Large File Download.
- User Name. The name of the user that caused the violation.
- Incident Created On. Date and time the incident was created.
- Incident Response. For Sanctioned applications, the Incident Response column displays the configured DLP response to the incident.
NOTE: For Shadow/Web applications, the Incident Response column displays the response actions configured in SWG for web traffic.
- Incident Status. Status of the incident.
- Service Name. The name of the Cloud Service Provider the incident pertains to.
- Instance Name. The name of the instance that the incident pertains to.
Other available table columns include:
- Account ID
- Account Name
- Activity
- CIS Level
- Comments
- Device ID
- Device IP
- Device Managed
- Device Type
- Event ID. When an event triggers multiple policies, and incidents are generated, the Event ID links all these incidents. If no Event ID is available, that means the incident was generated before Skyhigh CASB 4.4.0, when this feature was introduced.
- External Collaborators. Modified external collaborators are not shown in the column after a policy action is performed on the Cloud Card.
- External Collaborators Count
- File Size
- File Type
- Incident ID
- Incident Type
- Incident Updated On
- Internal Collaborators
- Item Created On
- Item Id
- Item Modified On
- Item Type
- Malware Category Name
- OS
- Owner
- Path
- Quarantine Status
- Recipient Domains. Displays the domain names of the recipient addresses. For example, if an outbound email is sent to Xyz@skyhigh.com and Cba@hpe.com then only the domain names such as hpe.com, skyhigh.com are listed in this column.
- Remediation Response
- Remediation Status
- Resolution Action
- Scan Name
- Scan Run Date
- Shared Link
- Source
- Total Match Count
- User Agent
- Vulnerabilities
Sanctioned Attributes. The Policy Incidents table columns might also reflect up to 10 mapped Sanctioned Attributes from Active Directory uploaded by Enterprise Connector. When mapped, you can also search for these Attributes using the Omnibar. But note, if the mapping changes, that affects what you can see and do with these Attributes. For help mapping AD attributes, contact Skyhigh CASB Support.
NOTE: In the Response column, Archived policy violations do not appear in table results unless you explicitly filter for them in the Omnibar.
Policy Violation to Sanctioned DLP
On the Policy Incidents Summary and Policy Incidents page, the Incident Type filter label and Omnibar value Policy Violation is changed to Sanctioned DLP. For reports, the CSV and XLXS reports are not affected, but, PDF reports reflect the new string name as PDF reports capture the screen as displayed.
Filter for Unsuccessful Deleted Remediation Status
This filter allows you to search for the Unsuccessful Deleted remediation status, to more easily find and remediate failed items in the Remediation Column.
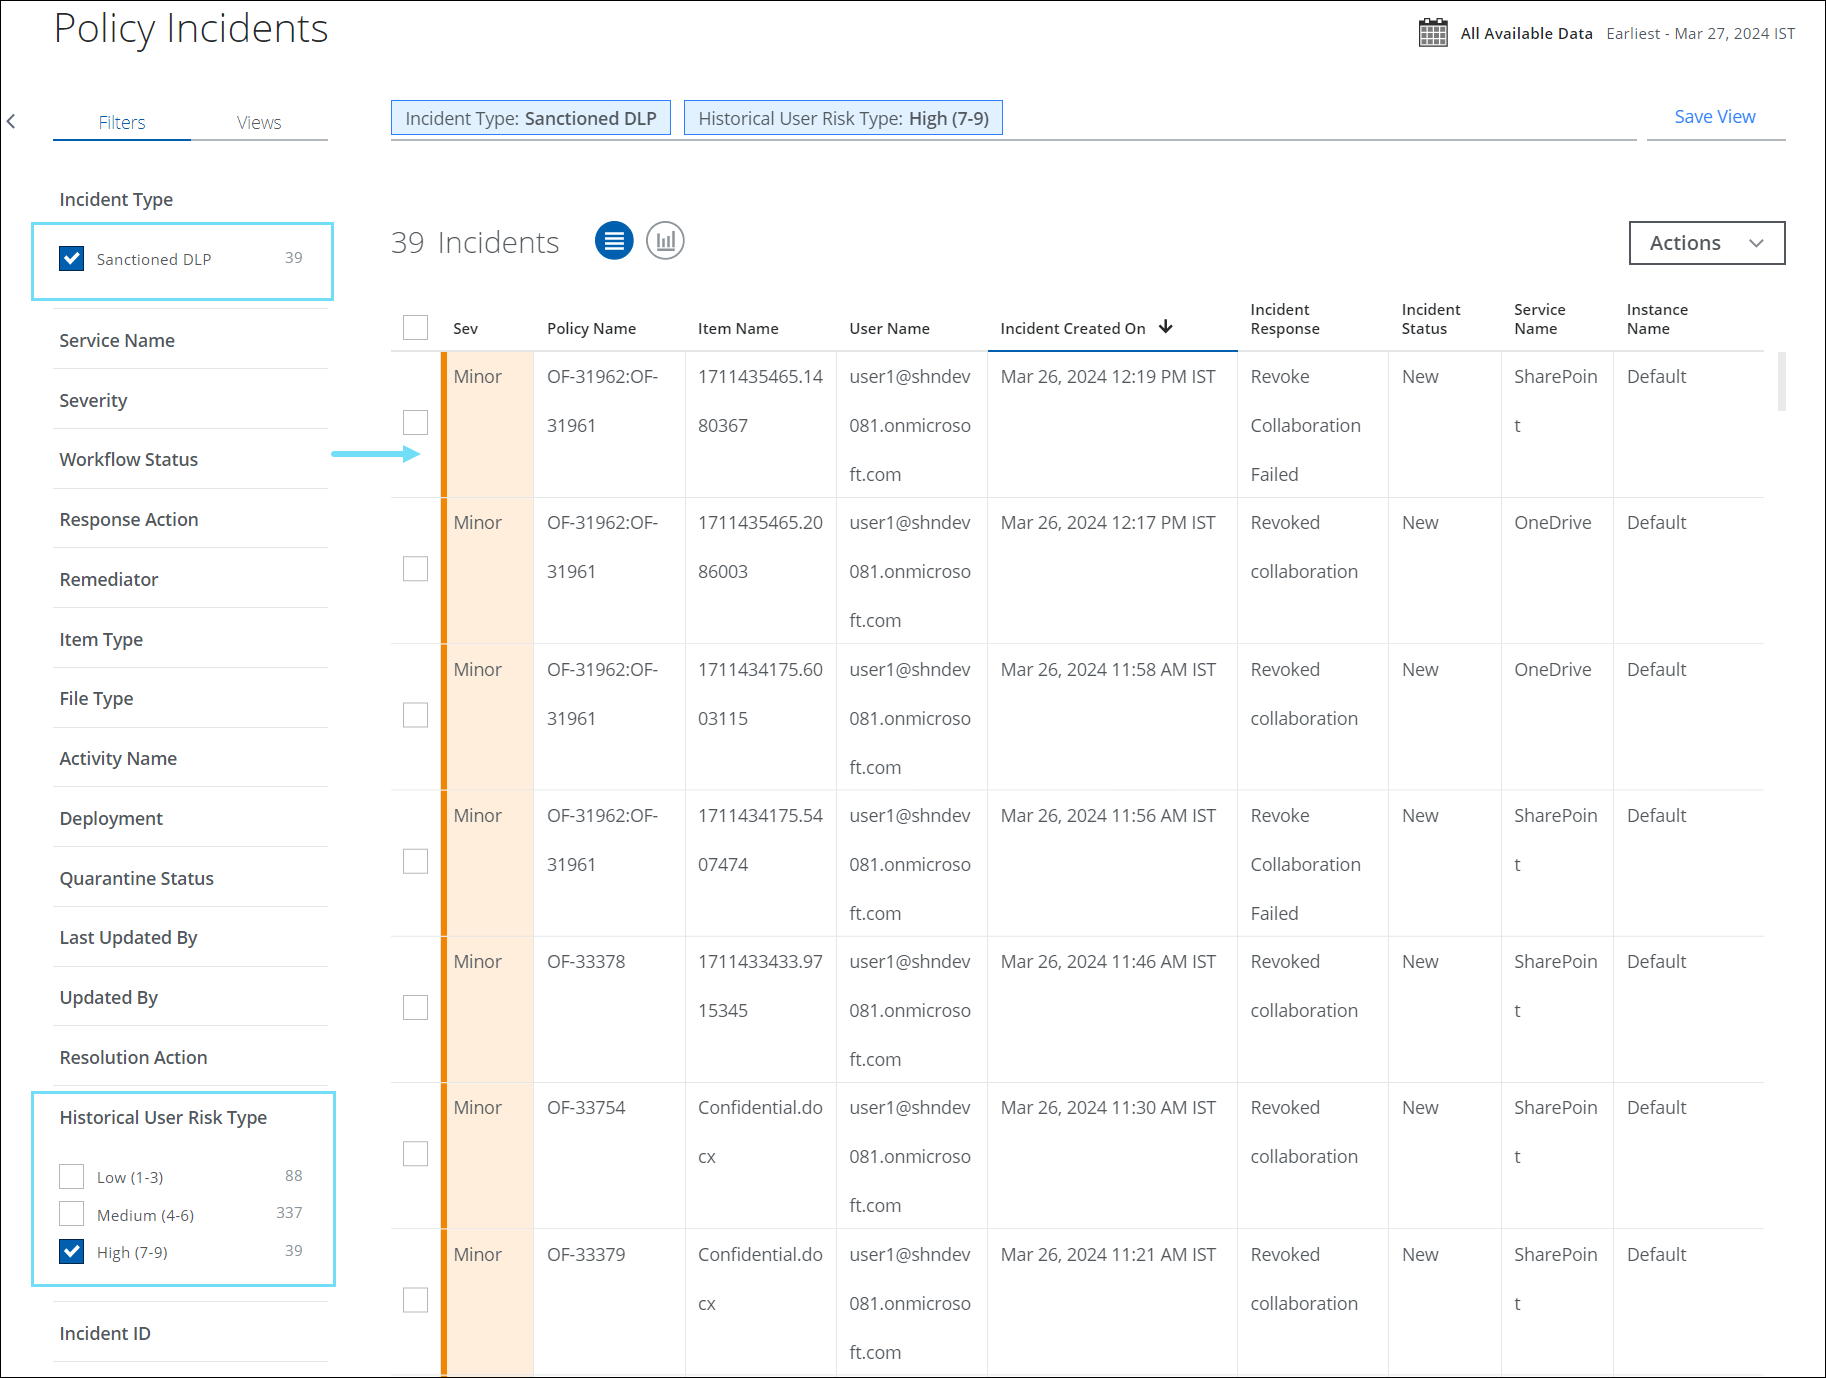
Historical User Risk Type Filter for Sanctioned DLP Incidents
You can now filter and categorize your search by Historical User Risk Type for Low, Medium, and High-risk users in the Sanctioned DLP Policy Incidents.
Historical User Risk Score is a risk score assigned to the user whenever the incident is created and it is rated on a scale of 1–9. This score is measured based on various factors such as the severity of the violation, the user’s security posture, and metadata about the user's overall compliance history. The score identifies the deviations as High, Medium, and Low-risk types:
- High (7-9). This score indicates a great potential for cloud services and data to become vulnerable to threats. This level is the least trustworthy.
- Medium (4-6). This score indicates a moderate potential for cloud services and data to become vulnerable to threats.
- Low (1-3). This score indicates little potential for cloud services and data to become vulnerable to threats. This level is the most trustworthy.
The Historical User risk score allows you to track and manage user’s typical usage patterns related to data security, and take necessary actions to strengthen the defense against potential threats in your organization.
To filter your Historical User Risk Type for Sanctioned DLP Incidents:
- On the Policy Incidents page, select the Incident Type filter as Sanctioned DLP and Historical User Risk Type as Low (1-3).
- Click any incident on the table to open the cloud card and view the Historical User Risk score of the user and activities details. To view the Historical User Risk Score, see the Policy Incidents cloud card.
Download Evidence Files for Sanctioned DLP Incidents
You can now download evidence files that are linked to Sanctioned DLP incidents individually on the Policy Incidents page.
DLP Evidence is a copy of the compromised content that violates a Sanctioned Data Loss Prevention (DLP) policy detected during the policy evaluation. The downloaded evidence files enables you to view the details of the violated DLP incidents and perform additional forensics on the generated incidents.
You can apply Role-Based Access Control (RBAC) to control the download of evidence files for Sanctioned DLP incidents. For details, see Download Sanctioned DLP Evidence.
To download evidence files for Sanctioned DLP Incidents:
- On the Policy Incidents page, select the Incident Type filter as Sanctioned DLP.
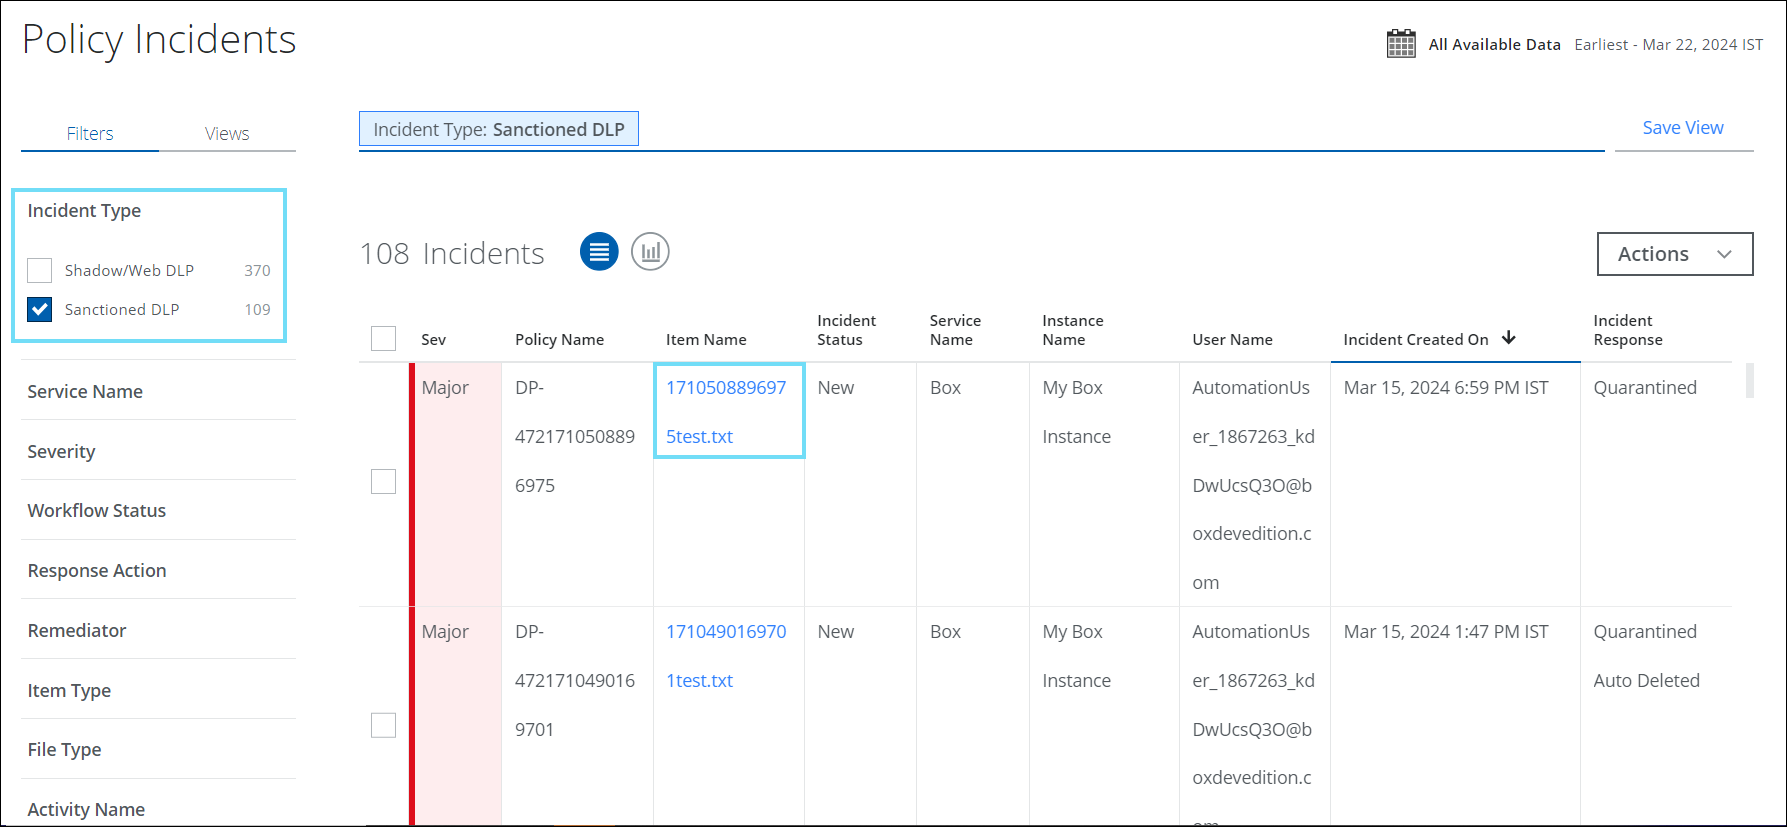
- Click the link in the Item Name column corresponding to an incident to download the evidence file.
NOTE: You can also apply RBAC to control the download of evidence files for Shadow/Web DLP incidents. For details, see Download Shadow/Web DLP Evidence.
Chart View
To display your Policy Incidents data in a chart, click the Chart icon, under the Omnibar.
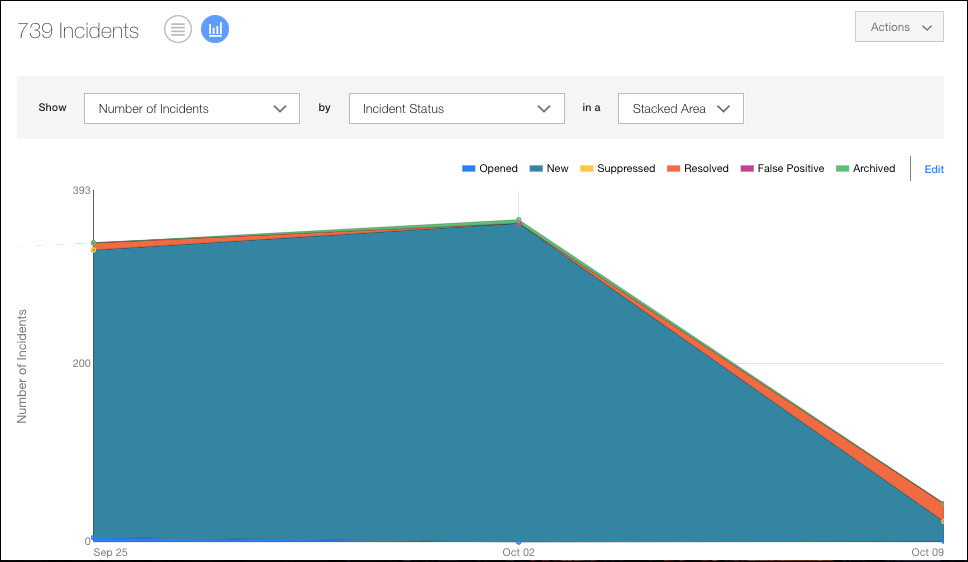
To display Policy Incidents data in a chart:
- Select an item from the Show list to determine the X-axis of your chart.
- Select an item from the By list to determine the Y-axis of your chart.
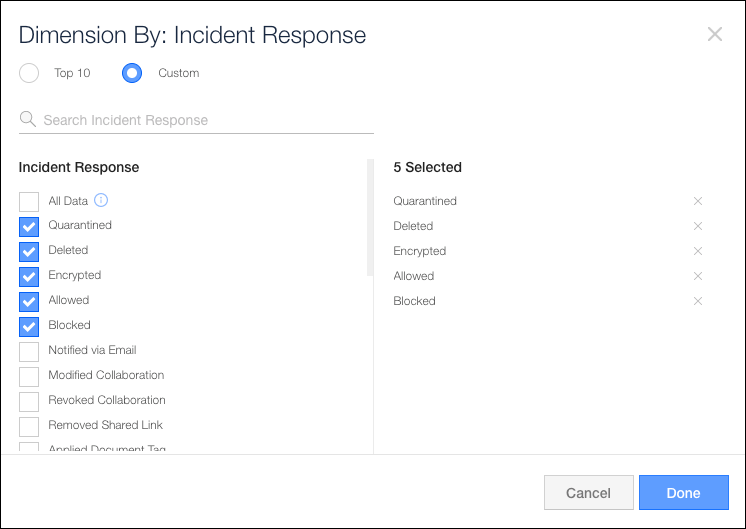
- In the Dimension By dialog, select All Data, select Top 10, or select up to 10 items from the list. Then click Done.
- From the In a list, select the type of chart available:
- Trend. Line or vertical bar chart.
- Breakdown. Donut or horizontal bar chart.
Your data is displayed in the chart.
To edit your chart's Dimension By data, click Edit.