Threats Page
The Threat Protection page located at Incidents > Threats handles all detection and resolution for threats.
IMPORTANT: This page is only accessible using Chrome or IE 11 Web browsers.
All Services threats are consolidated on this page, or you can choose to view the threats occurring in just one Service. You can view threats incident in a Table view. It also provides easy access to filters, Saved Views, and displays threat details with a single click.
The Threats page Table view is the default view.
To learn more about the threat, click to view the Threat Cloud Card.
You can also add the Threats card to your Dashboards. For details see About My Dashboard.
Table View
Select a Service using the Service Name filter to view and analyze incidents for that service. Only services with active Skyhigh CASB Secure licenses are available.
The default Threats table displays information about specific threats associated with the clusters of anomalies that strongly suggest your cloud services may have been compromised. Your security response team will use this information to observe and respond to threats.
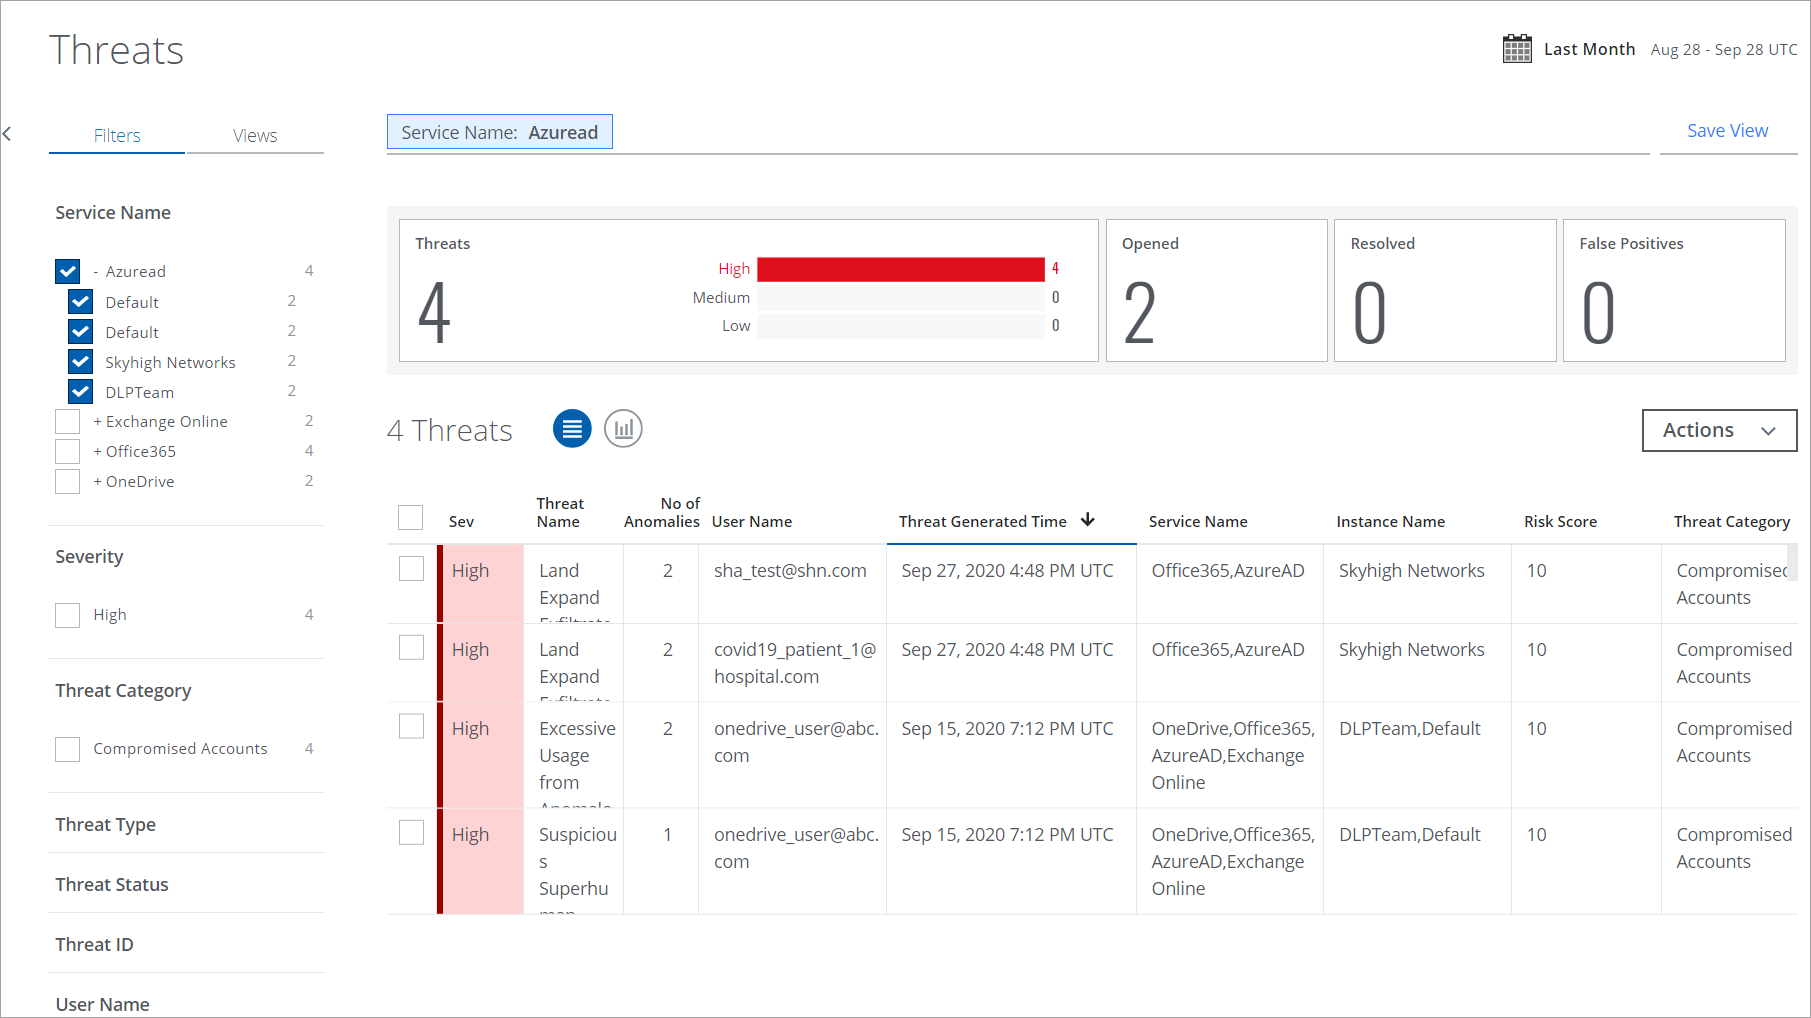
The Threats table provides the following information and actions:
- Search. Use the search bar to search your Threats with the options under the terms listed in Threat Protection and Activity Monitoring Search Terms.
- Filters. Select options on the Filters tab to scope down your search.
- Views. Select Saved Views created by you or shared with you by another user to reuse specified search parameters from a previous search on current data.
- Date Picker. Use the Date Picker to specify a date range to display data.
- Save View. Click to create a Saved View from your search query.
- Executive Summary. The Executive Summary displays an at-a-glance view of the current threat count in the Threats and Threat Status category with a weekly count of threats.
- Severity. Each threat is ranked based on severity.
- Red. High.
- Orange. Medium.
- Yellow. Low.
- Threat Name. The name of the threat.
- No of Anomalies. A number of anomalies in the threat.
- User Name. The user who triggered the threat.
- Threat Generated Time. The date and time that the threat was detected.
- Service Name. The service where the threat occurred.
- Instance Name. The instance where the threat occurred.
- Risk Score. The risk score depends on the severity of the threat.
- Threat Category. The category where the threat occurred.
- Actions. Click Actions to:
- Change Owner. To change the owner of multiple incidents.
- Change Status. To change the status of multiple incidents.
- Download CSV. Click CSV to Export Threats to a CSV File. The download begins immediately.
- Create Report.
- Business Report (PDF). Create a PDF report and run it immediately, which then appears in the Report Manager.
- CSV. Create a CSV report and run it immediately, which then appears in the Report Manager.
- XLS. Create an XLS report and run it immediately, which then appears in the Report Manager.
- Schedule. Schedule a report to run later, which then appears in the Report Manager.
- User Risk Report. Generate and download a User Risk Report to identify high, medium, and low-risk users for sanctioned services in your organization. You can generate or schedule a report, and access the generated reports via email or in the Report Manager.
NOTES:
- User Risk Report includes data from the last 100 days.
- You cannot view the Filters configured for the User Risk Report on the Schedule Report page.
Generate User Risk Report includes the following options:
- Generate Report. Click to generate a report. By default, the report is generated in the CSV file format. The report's title includes the report's name, current date, and time. For example, User Risk Report 10_09_23 1_56_50 PM UTC.
- Select your report format. Select CSV or XLSX file formats to generate a report.
- Schedule. (Optional) Schedule a report to run later, which then appears in the Report Manager.
An email is sent to the recipients with a link to download the report from Report Manager, and the report is attached if the size is less than 25 MB. The report includes user details such as username, user email, user risk score, number of incidents, threats, anomalies, activities, Active Directory (AD) attributes, and more.
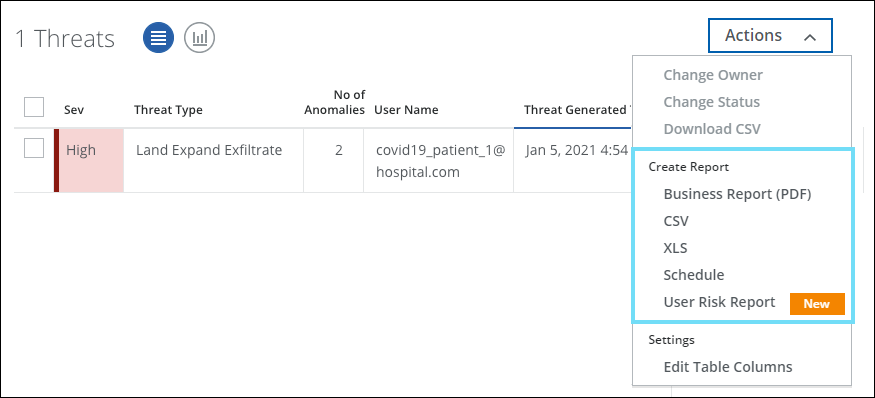
- Settings
- Edit Table Columns. You can edit table columns and save your changes as a Saved View.
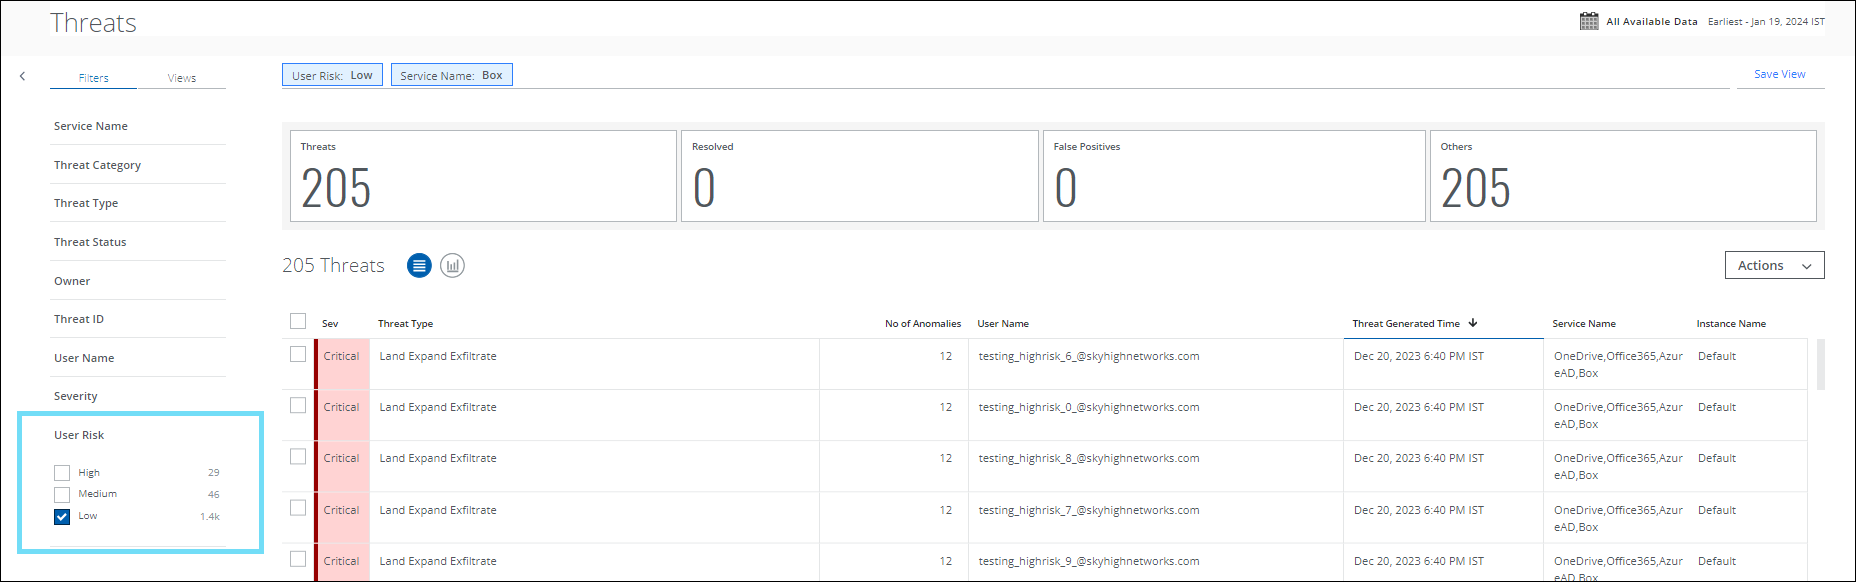
User Risk Filter
You can now filter and categorize your search by User Risk score for Low, Medium, and High-risk users on the Threats page. For example, to display the threats associated with low-risk Box users, select the service name, and then select Low on the User Risk filter. If there are no threats for the low-risk Box users in your tenant, then no threats will be displayed.
User Risk is also supported in Saved View, Chart View, Dashboard Cards, and Generate Reports for Business Report (PDF), CSV, XLS, and Schedule Reports.
Threat Cloud Cards
To view Threat details in the Cloud Cards:
- Click any threat in the table to see the Cloud Card for the specific threat, including information on which anomalies were used to determine the threat.
- Next, click the Anomaly Mini Card to view an extended Cloud Card that displays the type of anomaly.
- Then, click the link to the specific Anomaly Type to see an extended view of the sub-type of the anomaly.
- Click the Anomaly sub-type to view the details of the anomaly. For more information, see Anomaly Cloud Card. The Anomalies Cloud Card provides specific information about the threat. This is contextually based on the type of threat. This information can be used to better understand how this particular threat was generated and can assist in investigating the anomaly to determine if remediation actions are necessary.
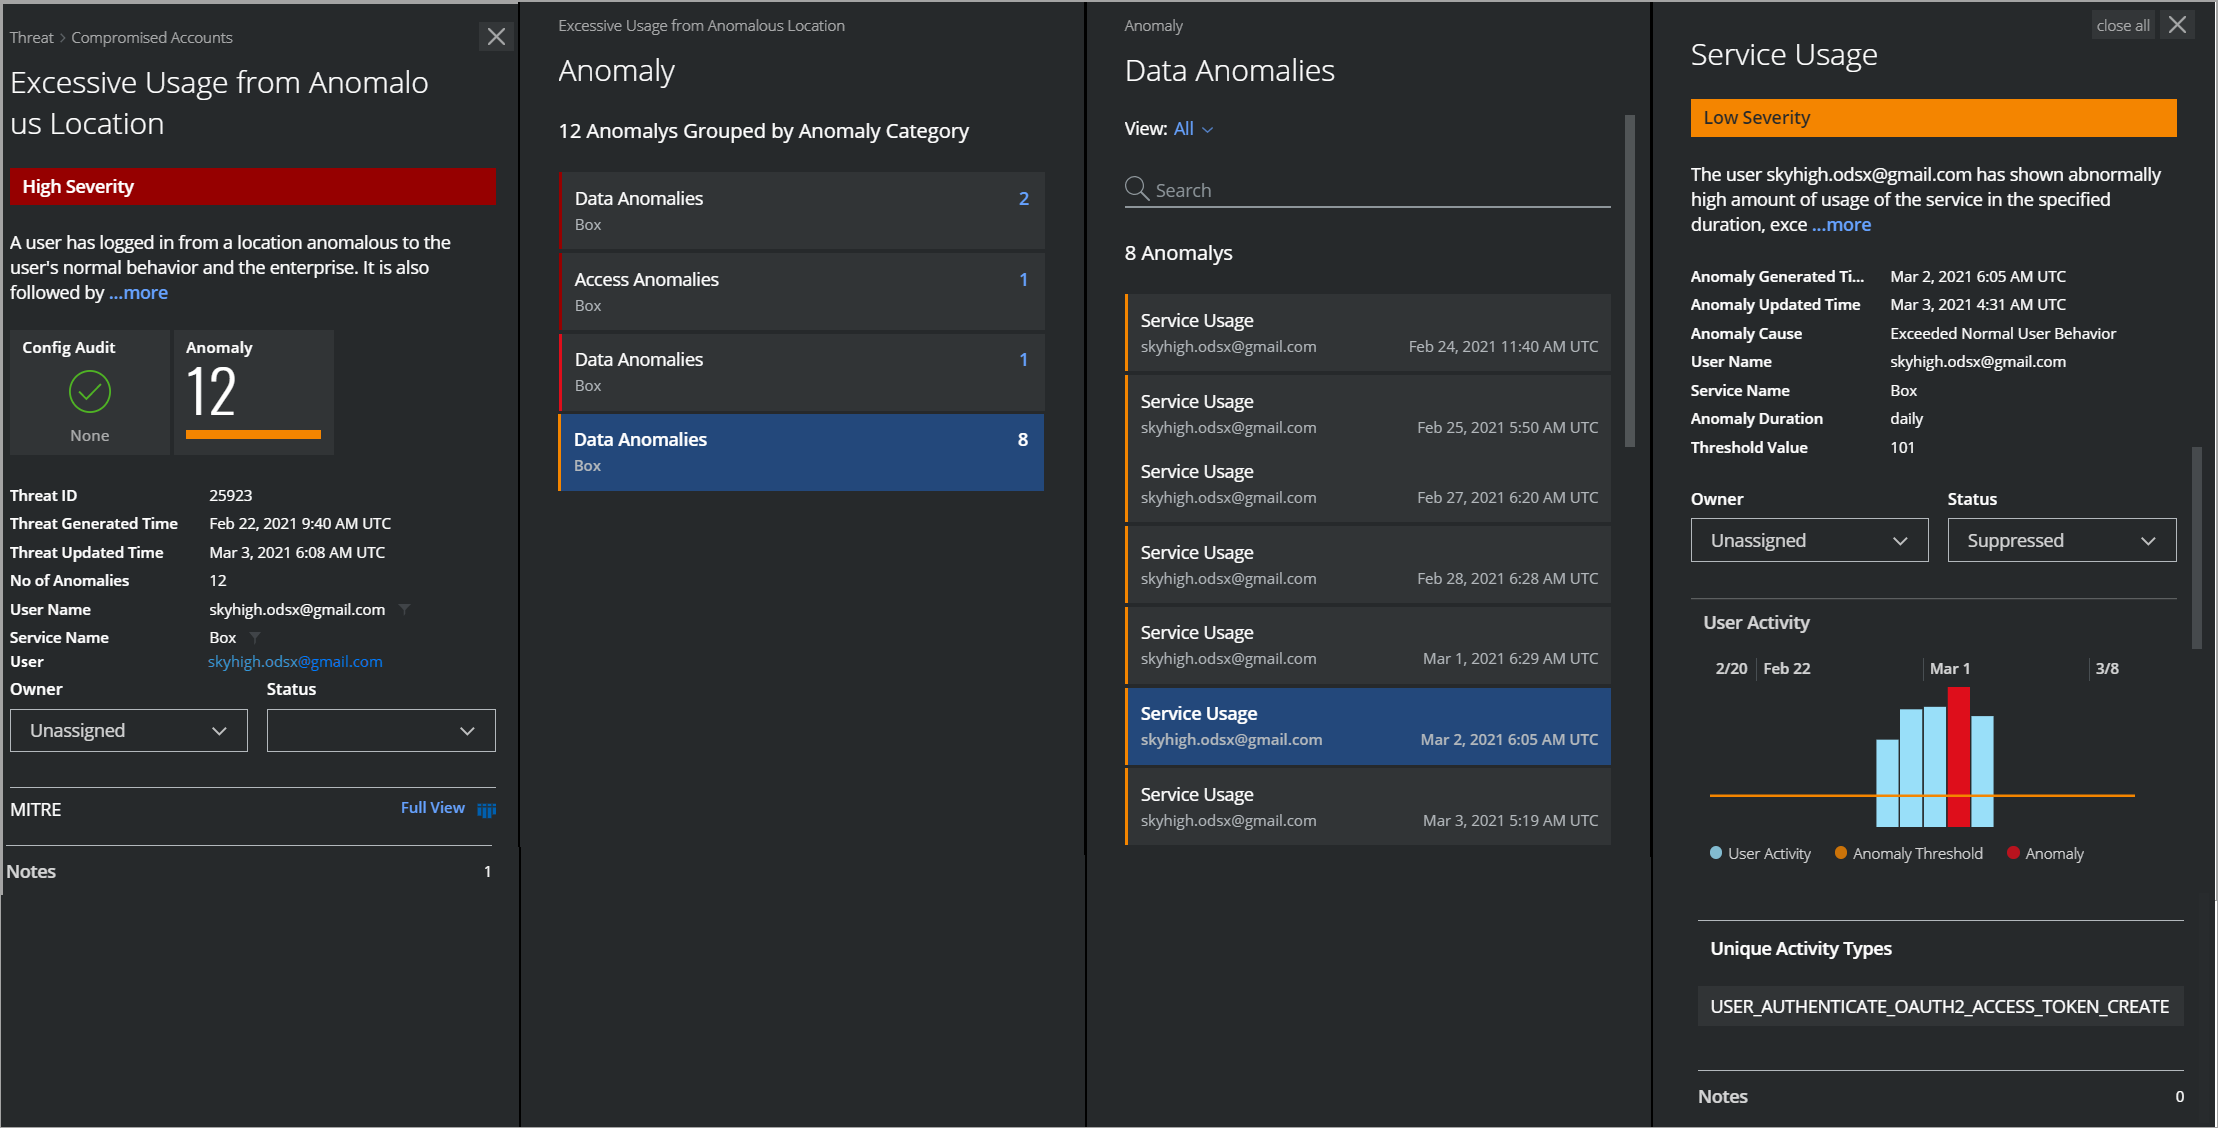
The First Threat Cloud Card provides the following information:
- Severity. The value (on a Low, Medium, and High scale) by how much the anomalies constituting the threat exceed the thresholds for each associated activity.
- Threat Name. The specific name of the threat.
- Description. A paragraph describes what the anomaly is and how it was generated. You can use this information to better understand what the threat represents and why it may indicate a risk to your data security.
NOTE: Mini Cards represent the security status of Config Audit and Anomaly. If your Config Audit incidents or Anomalies are secured, the text appears as None with a green checkmark. If your Incidents or Anomalies are at risk, then a horizontal bar is displayed with the incidents count. The color of the horizontal bar signifies the severity levels of the Incidents or Anomalies.
- Mini Cards. Mini Cards appear on the first Cloud Card. Click a Mini Card to view detailed information about threats that are causing a risk to your cloud services. The following are the categories of Mini Cards:
- Config Audit. The count shows the IaaS configuration audit incidents that are compromised.
- Anomaly. The count shows the anomalies against the cloud services that are reported.
- Threat ID. The identification number of threats.
- Threat Generated Time. The recorded time when the threat occurred.
- Threat Updated Time. The recorded time when the threat occurred and updated in Skyhigh CASB.
- Number of Anomalies. How many anomalies were used to identify the threat? Knowing how many anomalies contributed to identifying the threat can aid your investigation; a threat made up of many anomalies may represent a more important breach than one made up of just a few anomalies.
- User Name. The name of the user who triggered the threat. Knowing which user is connected to the anomaly will assist your investigation in order to find out the circumstances of the anomalous behavior directly.
- Service Name. The Cloud Service where the anomaly occurred.
NOTE: If you have multiple instances of a service configured, in the Service box, you will see those instances listed separately. These instances are not duplicates.
- User. Click to see User Details Cloud Card.
- Owner. Select to assign an owner.
- Status. Select the status of the threat.
- Opened. A threat is marked opened when it is resolved and found again as a threat to Skyhigh CASB.
- Resolve. Select to resolve a threat.
- False Positive. Select to mark a threat as false positive.
- MITRE. Click Full View to view the detected tactics and techniques associated with this threat on the MITRE dashboard.
- Notes. Enter a note for the threat and click Add. Each note added is visible separately below the Notes field. For notes that you have added, you can Edit or Delete them. For notes written by other users, you may only view them. The default limitation is 10 notes per incident, and 300 characters per note. To use the Incident Notes feature, you must use your own Data Storage. You cannot use Skyhigh CASB Data Storage. For details on configuration, see Data Storage.
Chart View
To display your Threat data in a chart, click the Chart icon under the Omnibar.
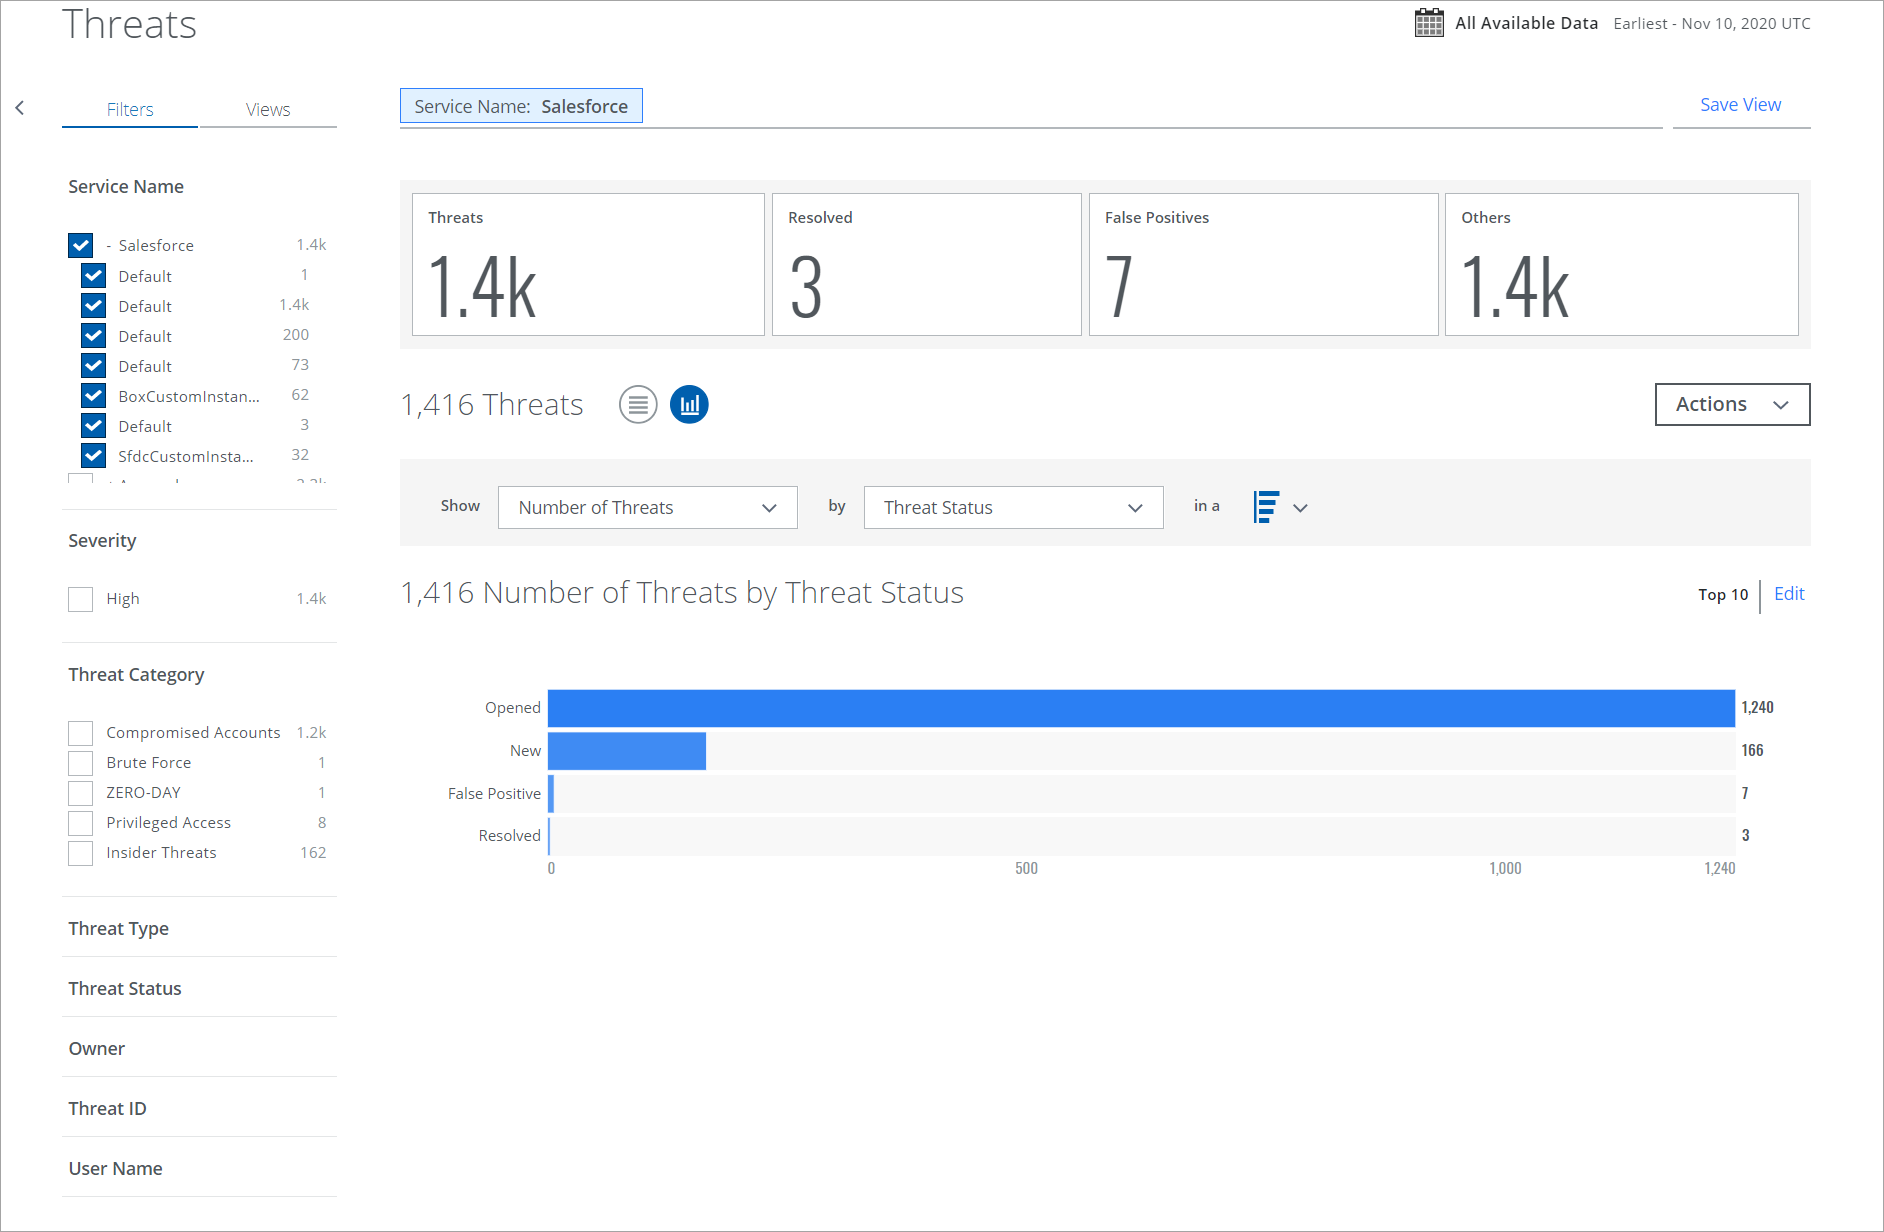
To display Threats data in a chart:
- Show. Select an item from the Show list to determine the X-axis of your chart.
- By. Select an item from the By list to determine the Y-axis of your chart.
- In a. From the In a list, select your chart type, if available:
- Trend. Line or vertical bar chart.
- Breakdown. Donut or horizontal bar chart.
Your data is displayed in the chart.
To edit an existing chart, click Edit.