Report - CSP Data Between Dates
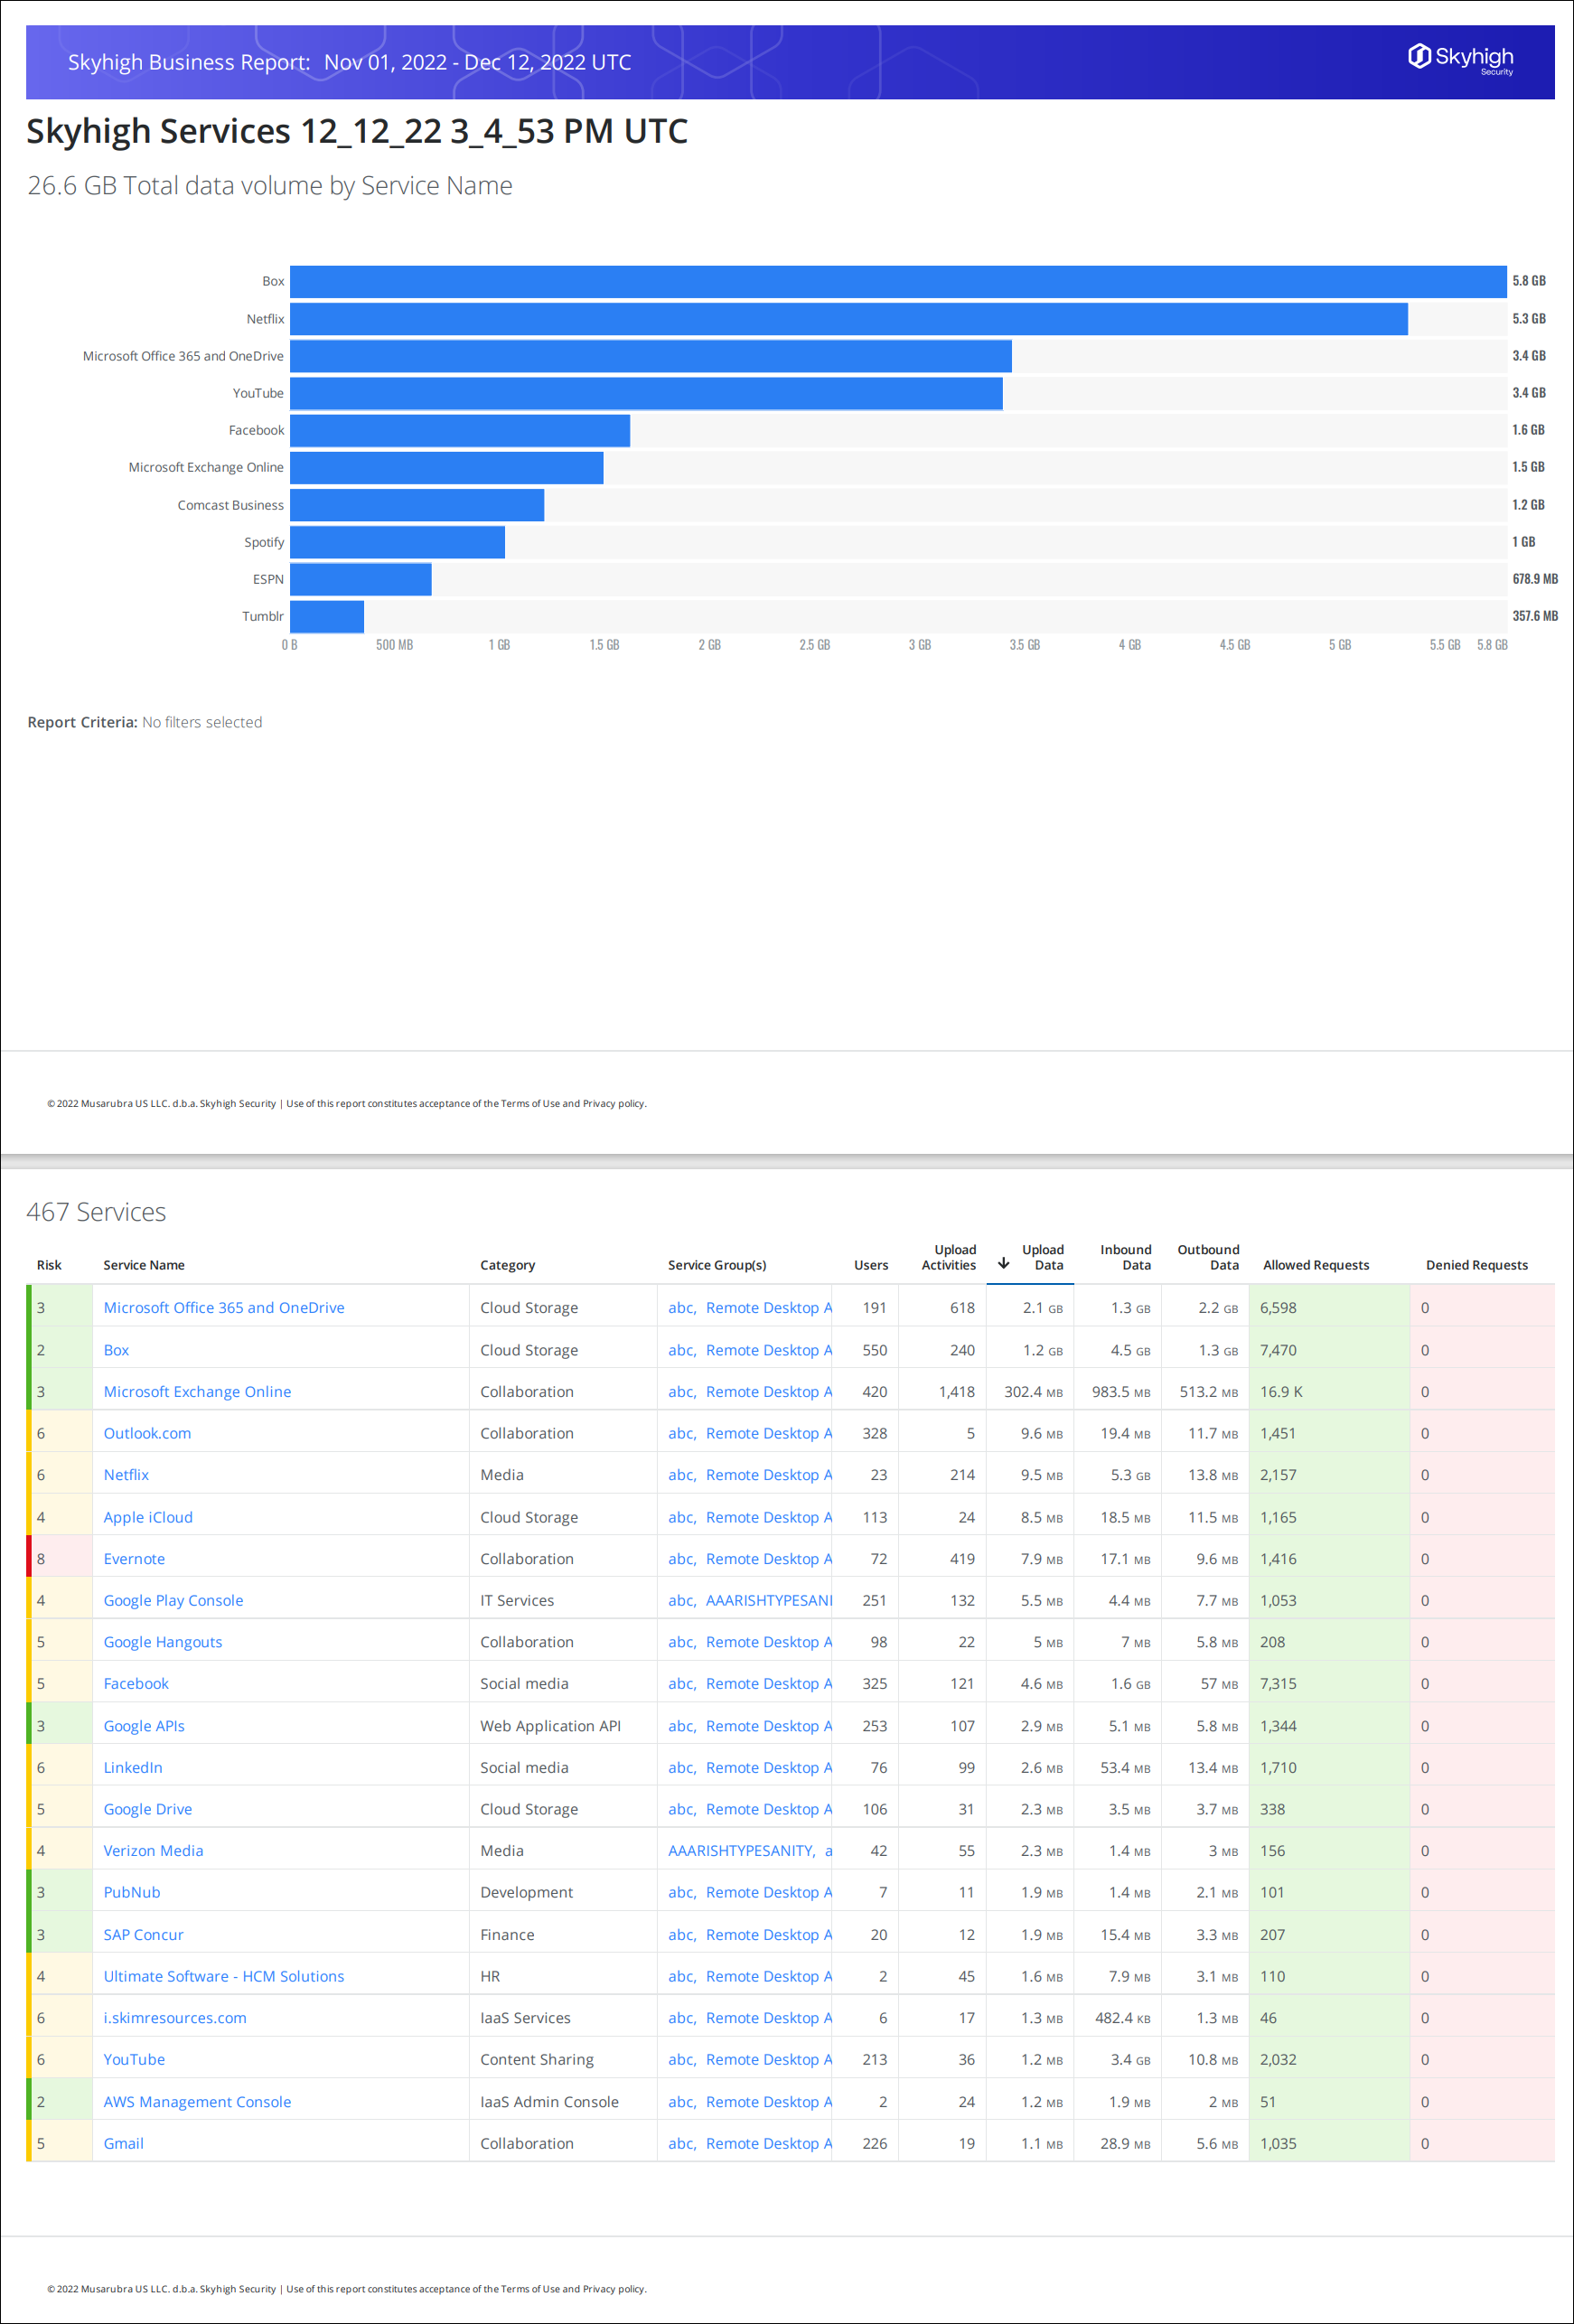
A report of services used during the specified date range, sorted by upload data.
To create the CSP Data Between Dates report:
- On the Services Overview page, click Actions > Edit Table to add the Service Last Used column.
- Click the Service Last Used column to sort by descending order.
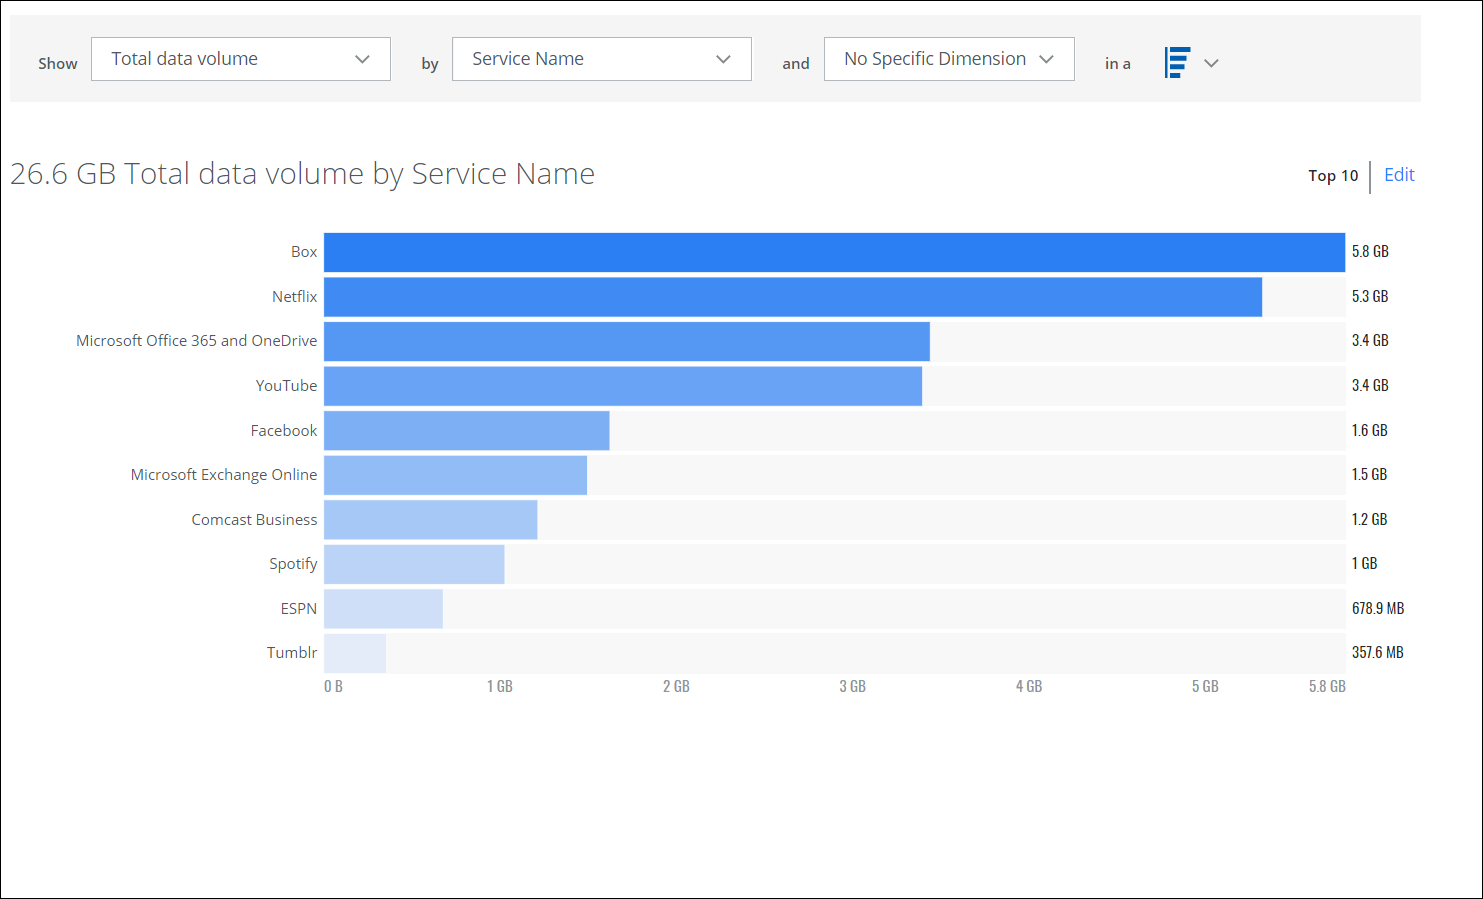
- Click the Chart icon. Create a chart to be displayed in your report. For example: Show Total Data Volume, by Service Name and No Specific Dimension in a Horizontal Bar.
- Click Edit to view Dimension By dialog where you can select Top 10 Service Names or Custom Service Names.
- Click Actions > Create Report.
The report is emailed to you in the format that you chose: Business Report (PDF), CSV, or XLS. The sample report below shows the Business Report (PDF) format.