About Custom Anomaly Incident
Custom Anomalies is an Anomaly type that enables you to create your own anomaly structure based on the risk parameters identified in the Sanctioned IT cloud service activities. Creating Custom Anomalies allows you to align with your organization's risk posture and raise an incident when anomalies are detected so this information can further assist your investigation of the anomaly. For details, see About Custom Anomalies.
If an anomaly is detected, the incidents are triggered on the Incidents > Anomalies page. You can view the custom anomalies incidents in a Table view or a Chart view. It also provides easy access to filters, Saved Views, and displays custom anomalies details with a single click. You can also add the Custom Anomaly card to your Dashboard. For details, see About My Dashboard.
Table View
Select Custom Anomalies using the Anomaly Category filter to view and analyze incidents for the custom anomaly. The Anomalies page Table view is the default view.
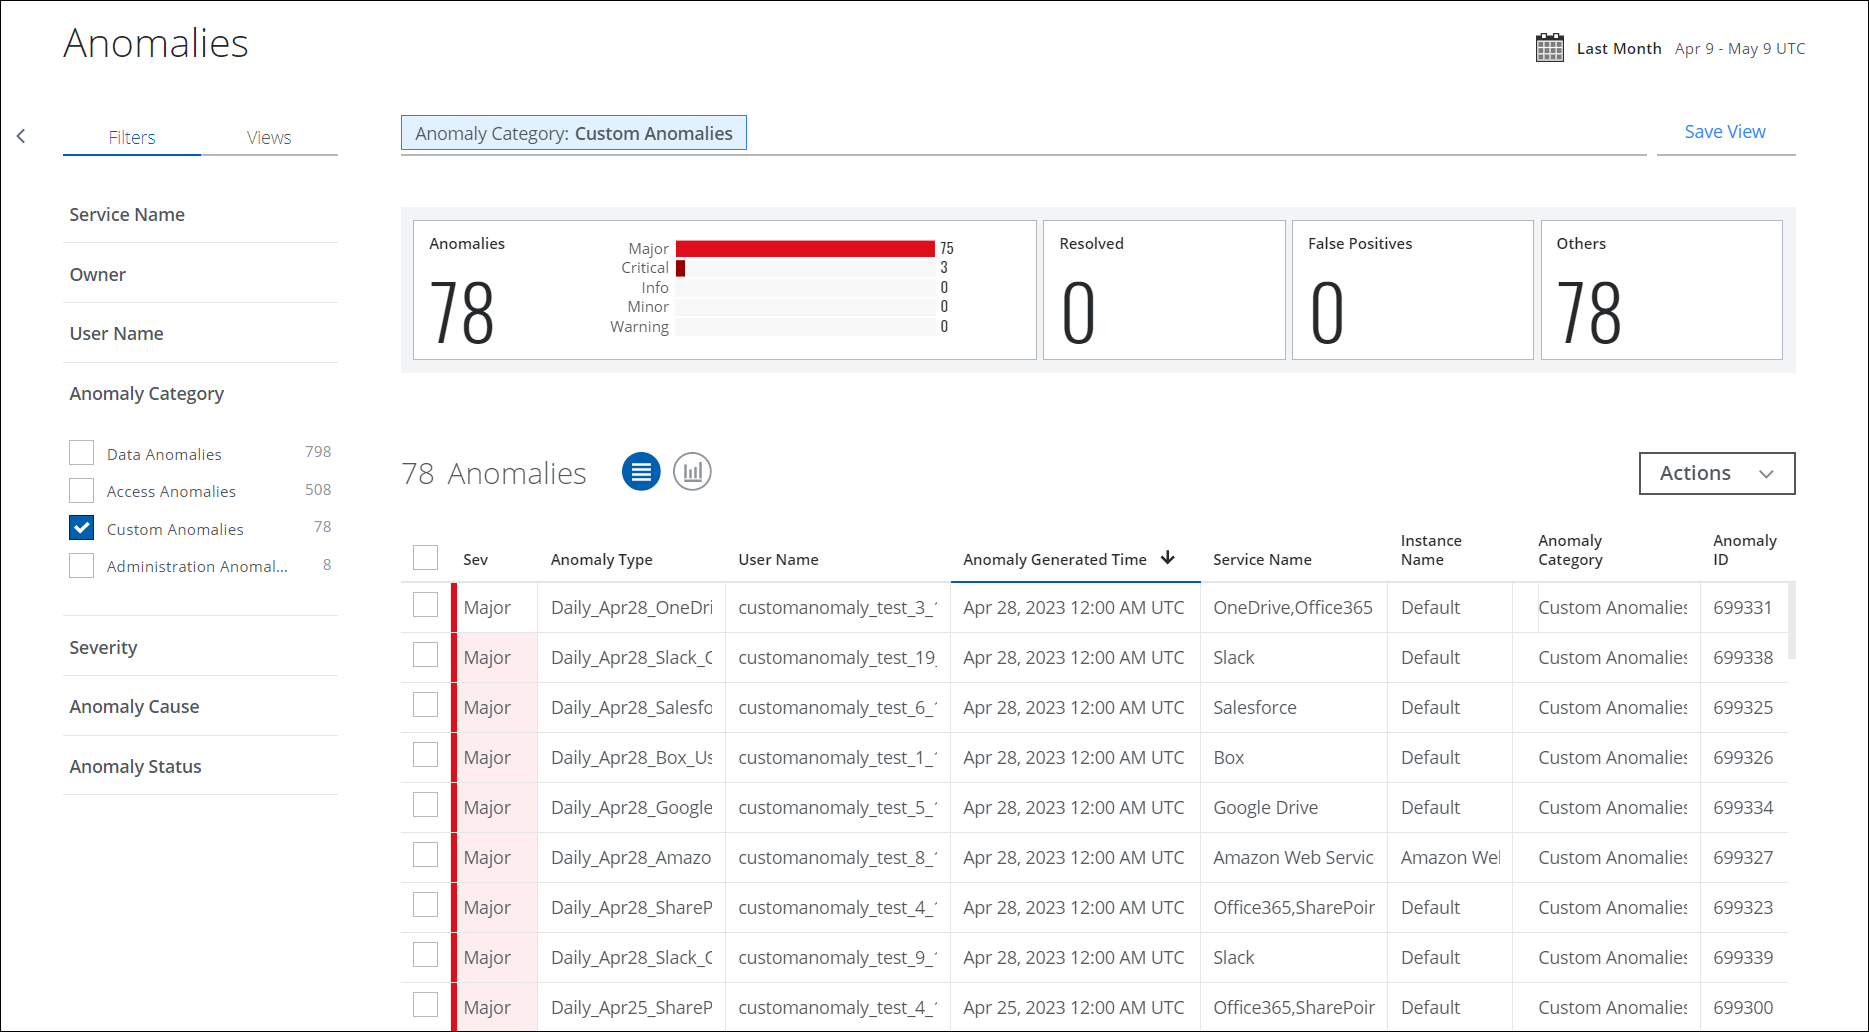
The Anomalies table provides the following information and actions:
- Search. Use the search bar to search your anomaly with the terms listed in Threat Protection and Activity Monitoring Search Terms.
- Filters. Select options on the Filters tab to scope down your search.
- Date Picker. Use the Date Picker to specify a date range to display data.
- Views. Select Saved Views created by you or shared with you by another user to reuse specified search parameters from a previous search on current data.
- Executive Summary. The Executive Summary displays an at-a-glance view of the current custom anomaly count in the Anomaly and Anomaly Status category with a weekly count of anomalies.
- Severity. Each custom anomaly is ranked based on severity.
- Red. High.
- Orange. Medium.
- Yellow. Low.
- Anomaly Type. The name of the anomaly type is derived from the Anomaly Category.
- Anomaly Category. The name of the anomaly category and the specific anomaly triggered to understand what sort of anomaly you are looking at and why it may represent a risk to your cloud services.
- User Name. The user who triggered the custom anomaly.
- Anomaly Generated Time. The date and time that the custom anomaly was detected.
- Service Name. The service where the custom anomaly occurred.
- Instance Name. The instance where the custom anomaly occurred.
- Anomaly ID. The identification number of custom anomaly.
- Actions. Click Actions to:
- Change Owner. To change the owner of multiple incidents.
- Change Status. To change the status of multiple incidents.
- Download CSV. Click CSV to Export Anomalies to a CSV File. The download begins immediately. It is suitable to import CSV into a third-party software security system or to open in a spreadsheet program. The data in the spreadsheet may provide greater detail than the details displayed in the UI.
- Create an Exception
- Adjust Anomaly Thresholds. Administrators may want to manually adjust anomaly detection thresholds to control the generation of new anomalies.
- Create Report.
- Business Report (PDF). Create a PDF report and run it immediately, which then appears in the Report Manager.
- CSV. Create a CSV report and run it immediately, which then appears in the Report Manager.
- XLS. Create an XLS report and run it immediately, which then appears in the Report Manager.
- Schedule. Schedule a report to run later, which then appears in the Report Manager.
- Settings
- Edit Table Columns. You can edit table columns and save your changes as a Saved View.
Custom Anomaly Cloud Card
Click any custom anomaly in the Anomalies table to see the Cloud Card for the specific anomaly, including information on how the anomalies were determined.
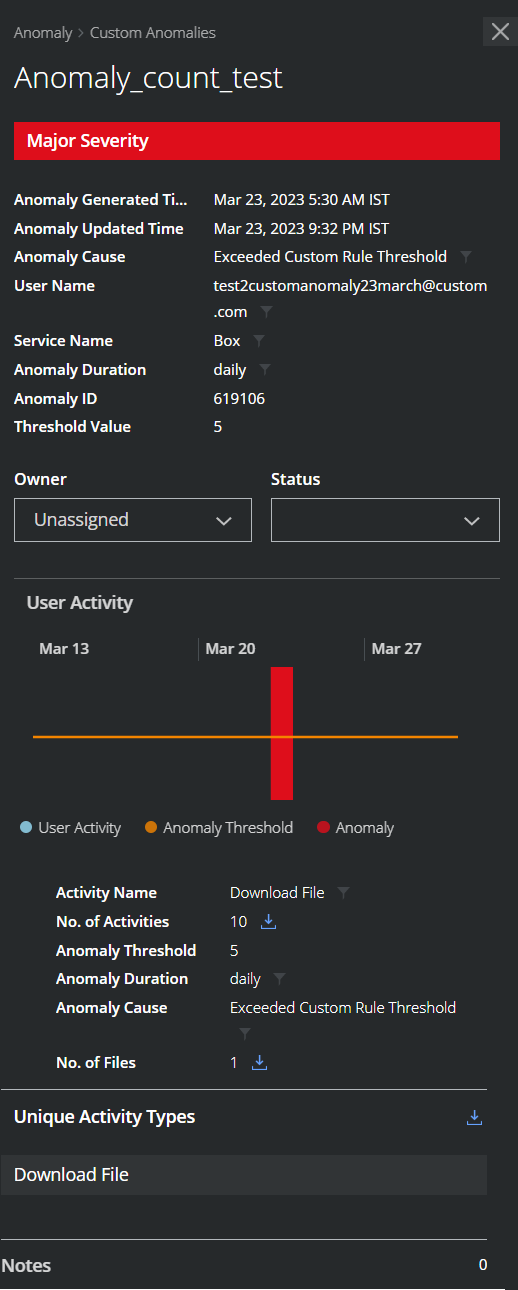
Custom Anomaly Cloud Card provides the following information:
- Anomaly Category. Displays the name of the selected anomaly category.
- Severity. The value (on a Low/Medium/High scale) indicates how much the custom anomaly exceeds the threshold for the action.
- Anomaly Name. The specific name of the custom anomaly.
- Anomaly Generated Time. The recorded time when the custom anomaly occurred. (This is dynamically adjusted to the local time zone of your computer.)
- Anomaly Updated Time. The recorded time when the custom anomaly occurred and updated in Skyhigh CASB.
- Anomaly Cause. The reason for which the custom anomaly occurred.
- User Name. The name of the user who triggered the custom anomaly. Knowing which user is connected to the custom anomaly will assist your investigation in order to find out the circumstances of the anomalous behavior directly.
- Service Name. The Cloud Service where the custom anomaly occurred.
- Anomaly Duration. The period of time when the custom anomaly exceeds the threshold for the action. Knowing when and for how long the custom anomaly occurred can assist in building a timeline for your investigation.
- Anomaly ID. The identification number of custom anomaly.
- Threshold Value. The activity count of custom anomaly.
- Owner. Select to assign an owner.
- Status. Select the status of the anomaly.
- Archived. The custom anomaly has been archived and removed from the table. (Archived custom anomaly does not appear in table results unless you explicitly filter for them in the Omnibar.)
- False Positive. Select to mark a custom anomaly as a false positive.
- Opened. A custom anomaly is marked opened when it is resolved and found again as an anomaly to Skyhigh CASB.
- Resolved. Select to resolve a custom anomaly.
- Suppressed. Select to suppress the custom anomaly that has been found to be a duplicate of a previously generated anomaly.
- User Activity. You can view threshold-based custom anomalies on the graph. For details, see the Threshold-Based Anomaly section.
- Unique Activity Types. Click the Download icon to download the various activities associated with this custom anomaly in the CSV file.
- Notes. Enter a note for the anomaly and click Add. Each note added is visible separately below the Notes field. For notes that you have added, you can Edit or Delete them. For notes written by other users, you may only view them. The default limitation is 10 notes per incident and 300 characters per note. To use the Incident Notes feature, you must use your own Data Storage. You cannot use Skyhigh CASB Data Storage. For details on configuration, see Data Storage.
Threshold-Based Anomaly
Anomaly thresholds are the foundation of the Skyhigh CASB Threat Protection platform. Understanding what the threshold was at the time of the anomaly is useful for determining the validity of an anomaly and can be used to identify a false positive. It displays a chart that shows the threshold and by how much the activity exceeded the threshold. This can be used to estimate the severity of an anomaly; an anomaly that significantly exceeds the threshold may incident a larger security risk than an anomaly that just slightly crosses the threshold.
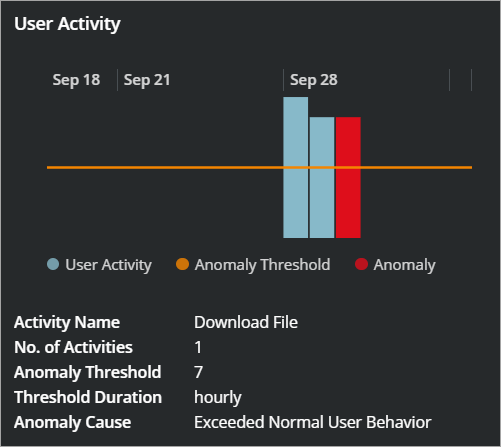
NOTE: In cases where the activity processing is delayed by more than an hour, the anomaly chart is unable to display.
The Threshold graph displays activity by date, with each vertical segment representing a day.
- Blue bars represent user data that does not represent an anomaly.
- Red bars represent user data that has exceeded the current threshold.
- The orange line represents the current thresholds. Any activity that exceeds the thresholds is registered as an anomaly.
The Threshold-based anomaly displays the following information:
- Activity Name. The specific name of more than 100 possible activities performed. Understanding which type of activity is monitored will aid in tracing back the action that triggered the anomaly during your investigation.
- No. of Activities. How many times during this period the activity occurred. Knowing how many activities contributed to the anomaly may help determine if this was a continued pattern of attack or a single event.
- Anomaly Threshold. The line at which the activity is considered an anomaly. Knowing how the anomaly was determined and to what extent the threshold was exceeded can aid your investigation.
- Threshold Duration. The period of time where the threshold is exceeded in order to count as an anomaly. Knowing when and for how long the anomaly occurred can assist in building a timeline for your investigation.
- Anomaly Cause. The reason for the anomaly.
Anomalies to Activity Cloud Card
Under Unique Activity Types, you can click to display details on Top Activities, then click an item in the list to drill down into specific user activities. This allows you to drill down to specific activities that led to an anomaly.
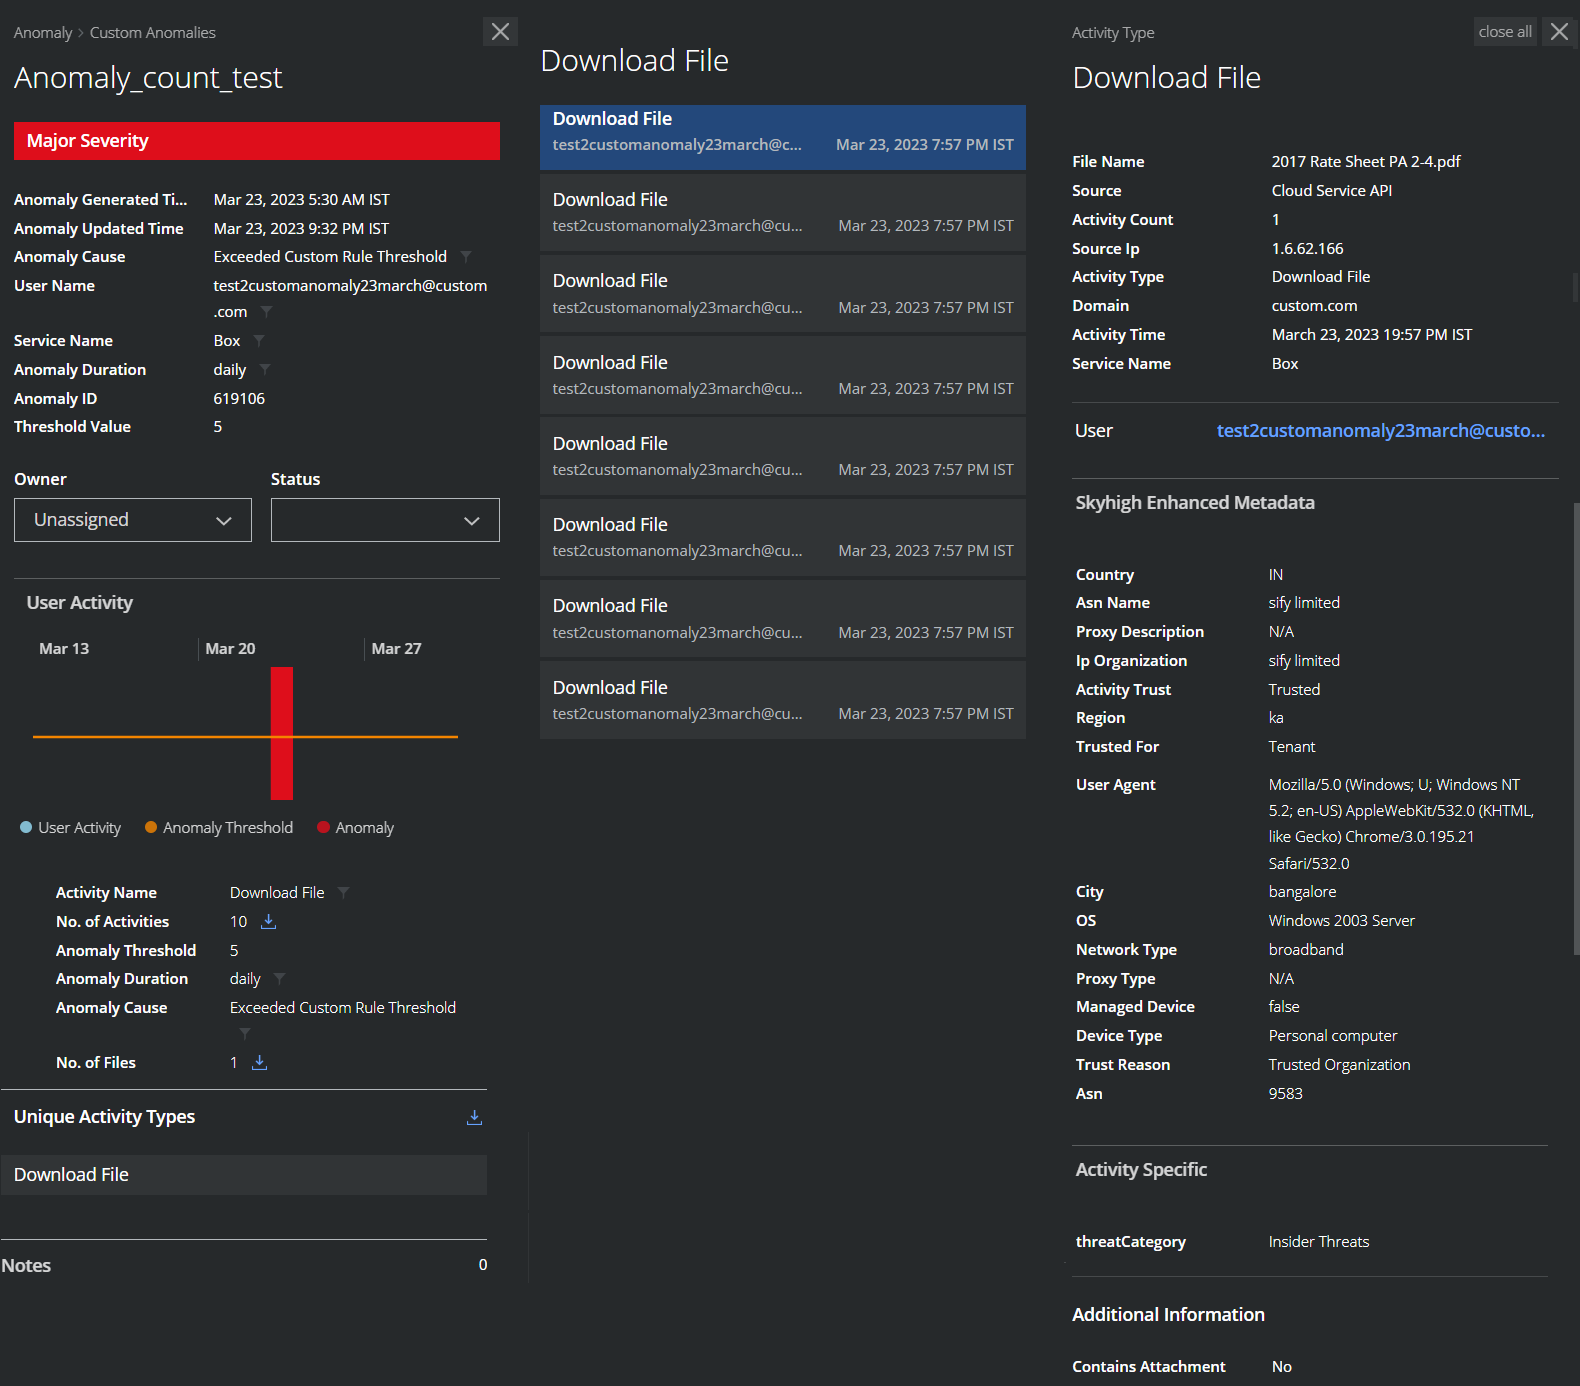
Chart View
To display your Custom Anomaly data in a chart, click the Chart icon under Omnibar.
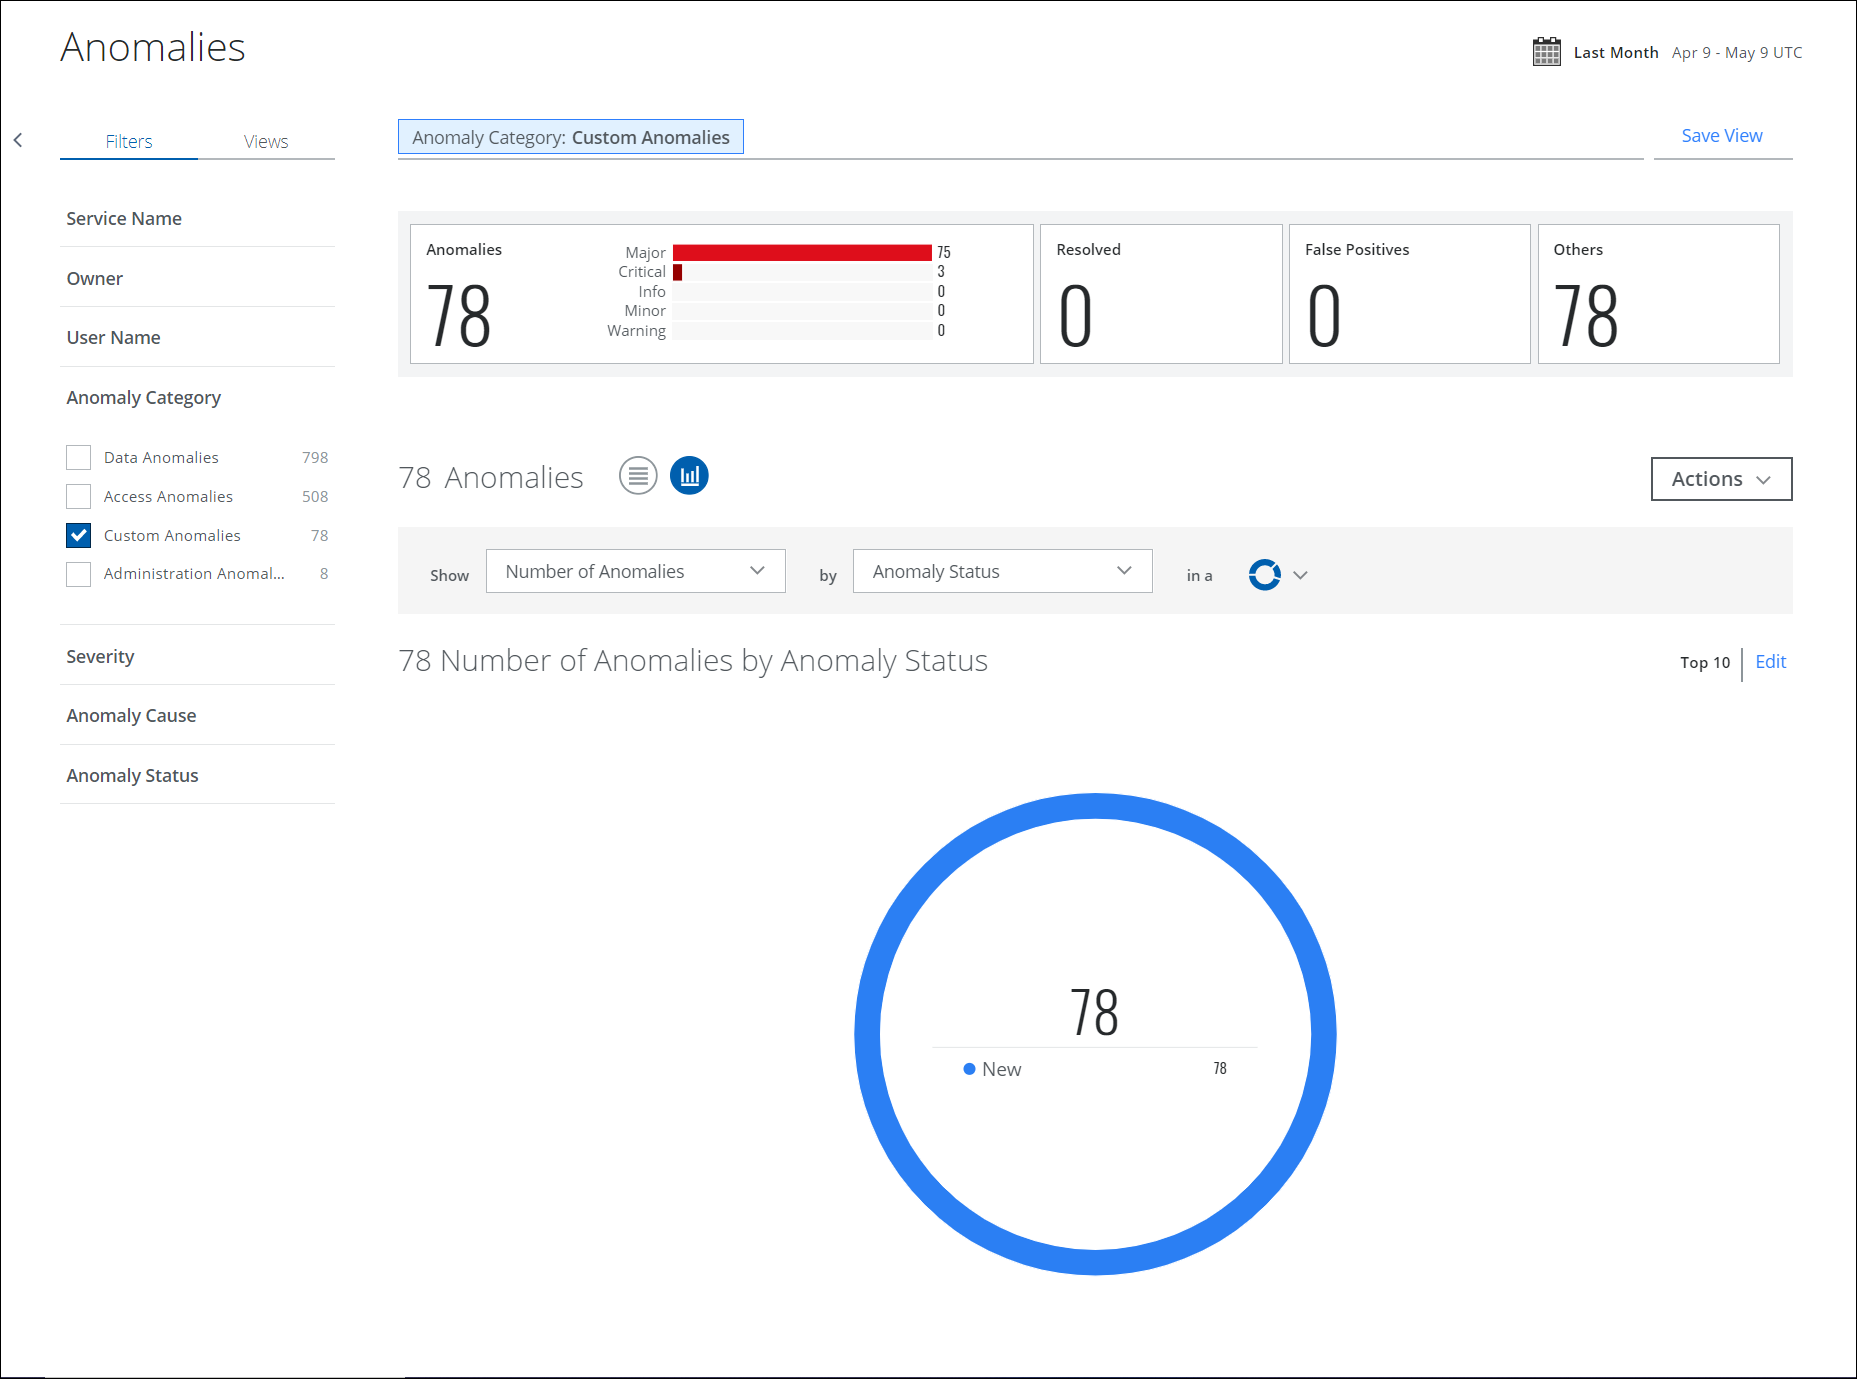
To display Anomaly data in a chart:
- Show. Select an item from the Show list to determine the X-axis of your chart.
- By. Select an item from the By list to determine the Y-axis of your chart.
- In a. From the In a list, select your chart type, if available:
- Trend. Line or vertical bar chart.
- Breakdown. Donut or horizontal bar chart.
Your data is displayed on the chart. To edit an existing chart, click Edit.