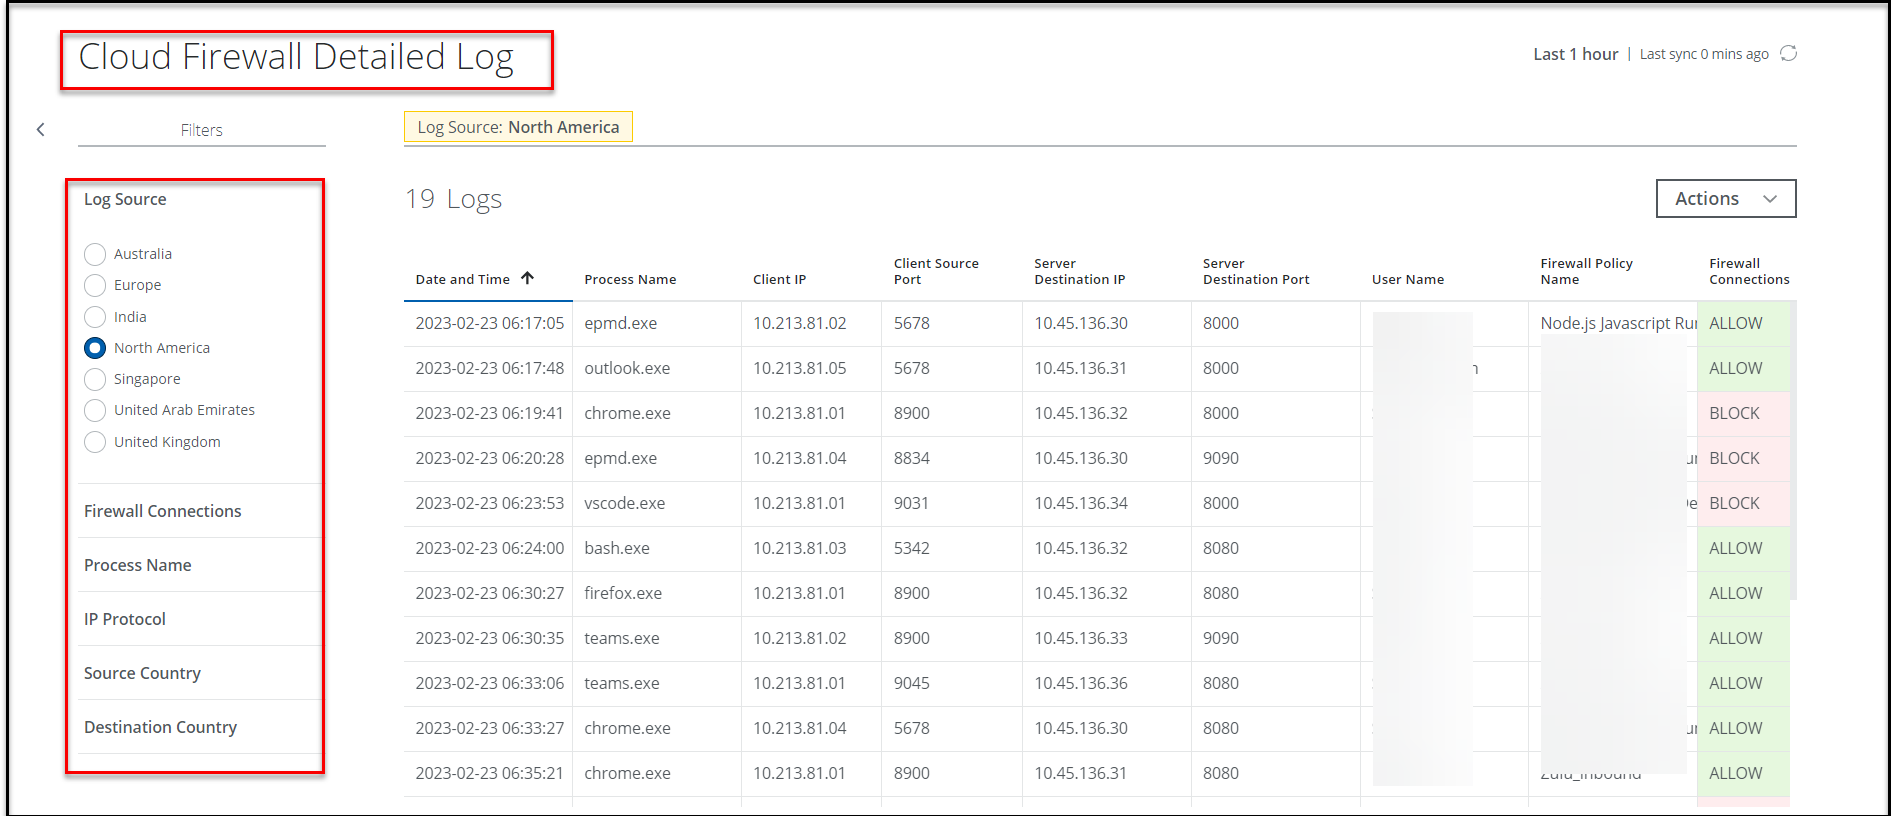
Cloud Firewall Detailed Log
The Cloud Firewall Detailed Log page allows you to view detailed firewall logs data for the past 1 hour. Based on the latest log data, you can effectively create policies. Use the filters to select a log source, process name, IP protocol, firewall connections, source and destination country. You can also use the search bar to search for a specific information.
To access it, go to Analytics > Cloud Firewall > Cloud Firewall Detailed Log.
The log data is displayed in a Table view with filters. You can also schedule the current view of the report to run every hour. You can either download these scheduled reports from the Reports section or provide an email address to automatically send reports to the recipients.
Table View
The Table view is the default view.
To display Cloud Firewall Detailed Log data in the Table view, you can:
- Search — Search for a specific data via Omnibar.
- Date — Displays the data for the last 1 hour. Set this to UTC: Coordinated Universal Time.
- Schedule — Schedule a report to immediately download the data in CSV format. later. You can either download these scheduled reports from the Reports section or provide an email address to automatically send reports to the recipients..
- Filters — Use filters to control the kind of data displayed on the Cloud Firewall Users page.
- Log Source — Select the data center location. You can select a log source to fetch the detailed log.
- Firewall Connections. Select the firewall connection type.
- Allowed — Select this option to view only allowed firewall connections.
- Denied — Select this option to view only blocked firewall connections.
- Process Name
- Select the process name.
- IP Protocol — You can select the IP protocol.
- Source Country
- Select the source country name.
- Destination Country
- Select the destination country name.
- Actions — Click Actions to:
- Create Report
- CSV — Create a CSV report and run it immediately, which then appears in the Report Manager.
- Schedule — Schedule a report to immediately download the data in CSV format. later. You can either download these scheduled reports from the Reports section or provide an email address to automatically send reports to the recipients.
- Settings
- Edit Table Columns — You can edit the table columns.
- Create Report
You can sort the following columns in ascending or descending order:
- Date and Time — Displays the time stamp of the log data.
- Process Name — Displays the process name.
- Client IP — Displays the IP address of the client.
- Client Source Port — Displays the port used by the Process for making the connection in the client device.
- Server Destination IP — Displays the IP addresses from which the connection is initiated.
- Server Destination Port — Displays the destination server port.
- User Name — Displays the user name.
- Firewall Policy Name — Displays the firewall policies applied.
- Firewall Connections — Displays the number of firewall connections.