Cloud Firewall Traffic
On the Cloud Firewall Traffic page, you can monitor all traffic from the desktop applications that bypasses Skyhigh SSE and traffic that drops at the endpoint. Use the filters to select a log source, process name, source and destination country, action taken, and firewall connections. You can also use the search bar to search for a specific information.
To access it, go to Analytics > Cloud Firewall > Cloud Firewall Traffic.
You can view the data in a Table view or a Chart view. It also provides easy access to Filters, Saved Views, and allows you to use the Date Picker to limit search results to a specified time period. You can also schedule the current view of the report to run itself daily, weekly, or monthly, every three months, or yearly. You can either download these scheduled reports from the Reports section or provide an email address to automatically send reports to the recipients.
Table View
The Table view is the default view.
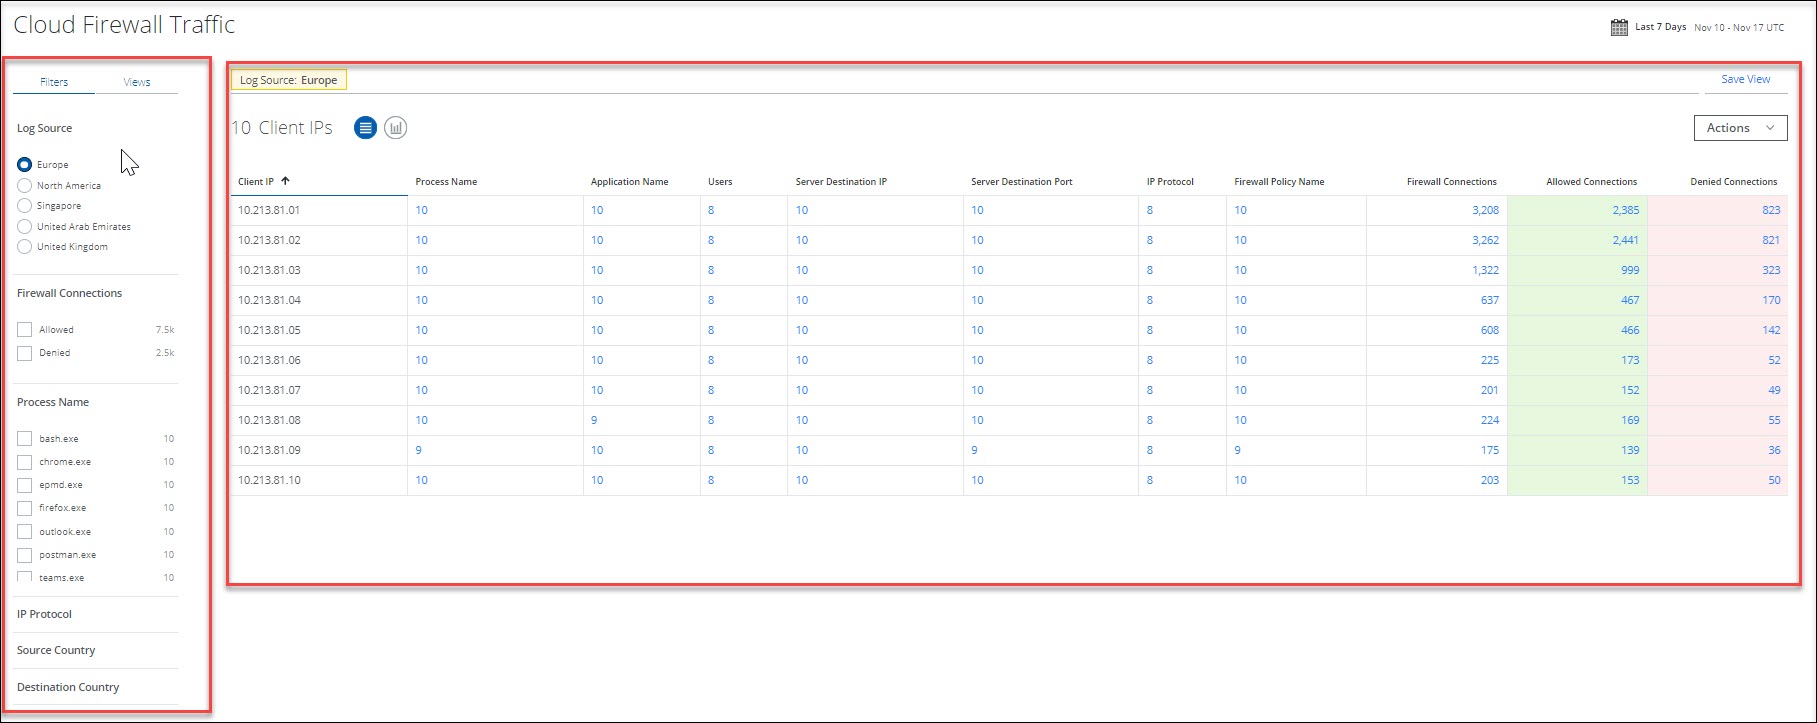
To display Firewall Traffic data in the Table view, you can:
- Search — Search for a specific data via Omnibar.
- Save View — Click to create a Saved View from your search query.
- Date Picker — Use the Date Picker to select a preset or custom date range to display data from only this date range. Set this to UTC: Coordinated Universal Time.
- Filters — Select options on the Filters tab to scope down your search.
- Views — Select Saved Views created by you or shared with you by another user to reuse specified search parameters from a previous search on current data.
- Log Source — Select the data center location. You can select a log source to fetch the firewall traffic details.
- Firewall Connections — Select the firewall connection type.
- Allowed — Select this option to view only allowed firewall connections.
- Denied — Select this option to view only blocked firewall connections.
- Process Name
- Select the process name.
- IP Protocol
- Select the IP protocol.
- Source Country
- Select the source country name.
- Destination Country
- Select the destination country name.
- Actions. Click Actions to:
- Create Report
- CSV — Create a CSV report and run it immediately, which then appears in the Report Manager.
- XLS — Create an XLS report and run it immediately, which then appears in the Report Manager.
- Schedule — Schedule a report to run later. Schedule the current view of the report to run itself daily, weekly, or monthly, every three months, or yearly. You can either download these scheduled reports from the Reports section or provide an email address to automatically send reports to the recipients.
- Settings
- You can edit the table columns.
- Create Report
You can sort the following columns in ascending or descending order:
- Client IP — Displays the IP address of the end user device initiating the request.
- Process Name — Displays the name of the process. Click on the count link to view the process name list.
- Application Name — Displays the name of the application accessed. Click on the count link to view the applications list.
- Users — Displays the number of users establishing connections with the process. Click the count link to open the Cloud Firewall Users page.
- Server Destination IP — Displays the IP address to which the end user's system is trying to connect. Click on the count link to view the destination IP address list.
- Server Destination Port — Displays the destination port. Click on the count link to view the destination port list.
- IP Protocol — Displays the number of protocols used by the application to make a connection. Displays the protocol used if there is only one protocol. Click on the count link to view the list of IP protocols.
- Firewall Policy Name — Displays the name of the firewall policy applied. Click on the count link to view the list of firewall policies applied.
- Firewall Connections — Displays the number of firewall connections. Click the count to open the Events page to view the complete traffic details for the selected client IP.
- Allowed Connections — Displays the number of allowed connections for the selected client IP. Click the count to open the Events page to view the complete traffic details.
- Denied Connections — Displays the number of denied connections for the selected client IP. Click the count to open the Events page to view the complete traffic details.
- Domain Name — Displays the domain names of the applications accessed by the user. Click on the count link to view the list of domain names accessed.
- Client Source Port — Displays the port used by the Process for making the connection in the client device. Click on the count link to view the source country port list.
- Source Country — Displays the source country name. Click on the count link to view the source country list.
- Destination Country — Displays the source country name. Click on the count link to view the destination country list.
- Total Bytes — Displays the total number of bytes uploaded and downloaded from an application.
- Downloaded Bytes — Displays the number of bytes downloaded from an application.
- Uploaded Bytes — Displays the number of bytes uploaded to an application.
- Client Host Name — Displays the name of the client host. The count is displayed in the case of multiple host names.
- Host OS Name — Displays the OS details of the client system. The count is displayed in the case of multiple operating systems running on a host.
Chart View
To display your Cloud Firewall Traffic data in a chart, click the Chart icon, under the Omnibar.
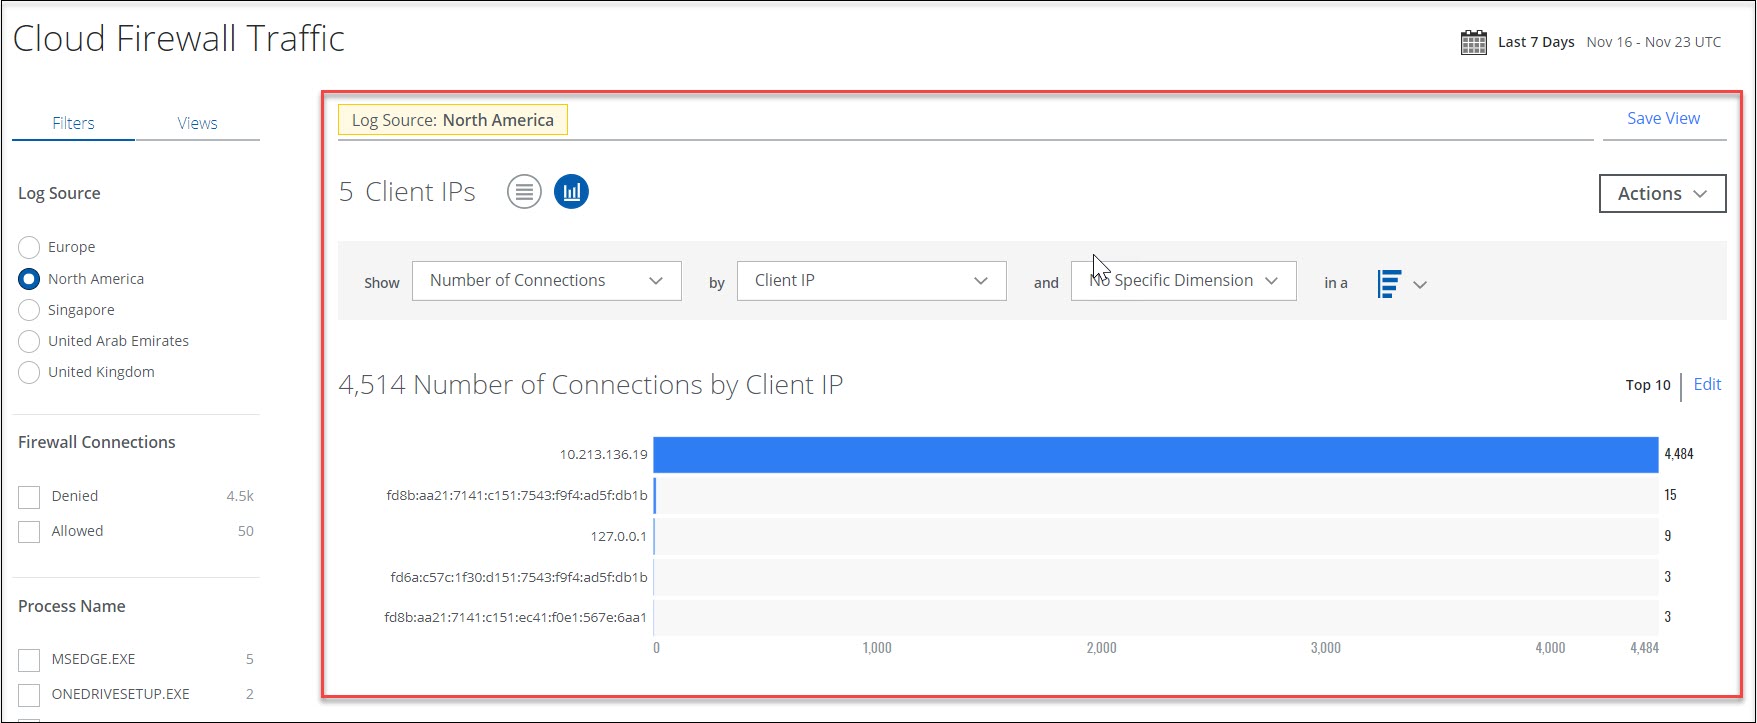
- Show — Select an item from the Show list to determine the X axis of your chart.
- By — Select an item from the By list to determine the Y axis of your chart.
- And — In the and dialog, select the third parameter, if available.
- In a — From the In a list, select your chart type:
- Trend — Line or vertical bar chart.
- Breakdown — Donut or horizontal bar chart.
Your data is displayed in the chart.
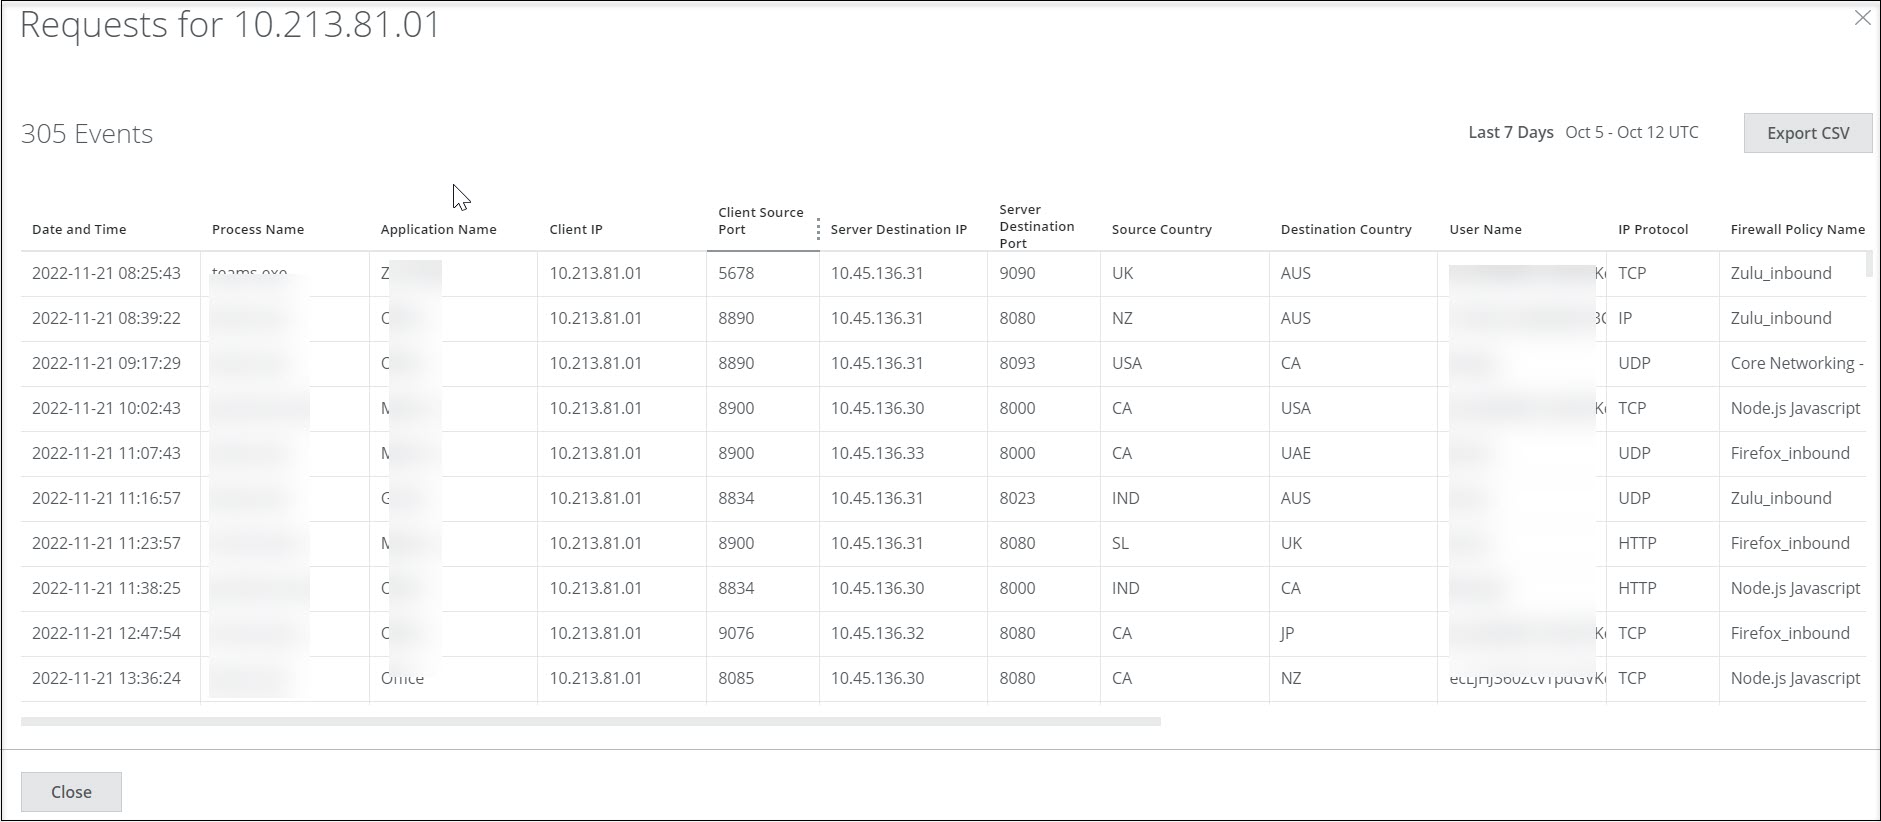
Events Data
You can view the details of the event for the selected client IP, details include timestamp of the event, process name, user, application name, client IP, client source port, firewall action taken (Allow/ Block), source country, destination IP, destination port, IP protocol, Gateway Egress source port, and Gateway Tunnel Ingress port applied to the traffic.
- Export CSV — Click to export the information in this table to an XLSX file in CSV format.
- Close — Click to close the Events Data page.