Connectors
The Connectors page provides the details of connectors, number of connectors configured in a connector group, number of private applications that are up and running, average utilization of all connectors in a connector group, and the timestamp of the last activity. You can also generate a report of the displayed data to CSV, XLS, or PDF formats.
Find this page at Analytics > Private Access > Connectors.
The Connectors page provides the following information and actions:
- Filters. Use filters to control the kind of data displayed on the Connectors page.
- Status. Select the connector status.
- Utilization. Select the utilization percentage of all the connectors configured in a connector group.
- Connector Group. Select the connector group associated with an application.
- Views. Create a Saved View and reuse it to search data at any time. You can also create your own dashboard using this saved view.
- Search. Use the Omnibar bar to search and view data that matches the criteria you specify.
- Save View. Click to create a Saved View from your search query.
- Actions.
- Create Report. Create a report of the displayed data to a CSV, XLS, and PDF file.
- Schedule. Schedule the current view of the connectors report to run itself daily, weekly, or monthly, every three months, or yearly. You can either download these scheduled reports from the Reports section or provide an email address to automatically send reports to the recipients.
- Edit Table Columns. Customize tables by sorting the data in ascending or descending order, resizing columns, and selecting certain columns.
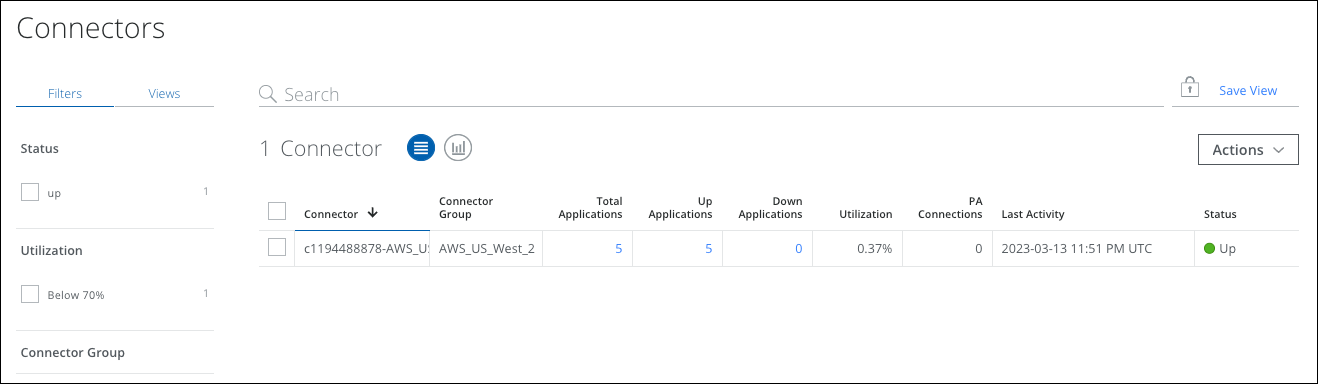
Table View
You can view the following information in either chart or table format:
- Connector. The name of the connector.
- Connector Group. The name of the connector group.
- Total Applications. The total number of applications assigned in a connector group.
- Up Applications. The total number of applications that are up and running.
- Down Applications. The total number of applications that are down.
- Utilization. Displays the utilization of a connector in percentage. Action to be taken if utilization is in red.
- PA Connections. Displays the total number of connections made to an application.
- Status. Displays the connector status.
- Last Activity. Displays the timestamp of the last activity in a connector group.