Discovered Private Applications
On the Discovered Private Applications page, you can monitor the applications that are accessed by the users. This helps you gain insight of the applications that are used most and configure policies accordingly. You can use the Date Picker to limit search results to a specified time period.
After adding private applications using application/network or both, we will see a comprehensive list of the applications accessed within the private network. Preferably, allow a few days or a week to elapse prior to using this page to discover the applications used by users.
Once we have a comprehensive list of the applications accessed within the private network, we can generate report by clicking Action > Create Report > CSV or XLS
You can also schedule the current view of the report to run daily, weekly, and monthly. You can either download these scheduled reports from the Reports section or provide an email address to automatically send reports to the recipients.
All of these applications discovered on the discovered private applications page can be imported into the private application configuration page, for more details on how to import the applications see Add Applications by Importing a List
You can access this page from Analytics > Private Access > Discovered Private Applications.
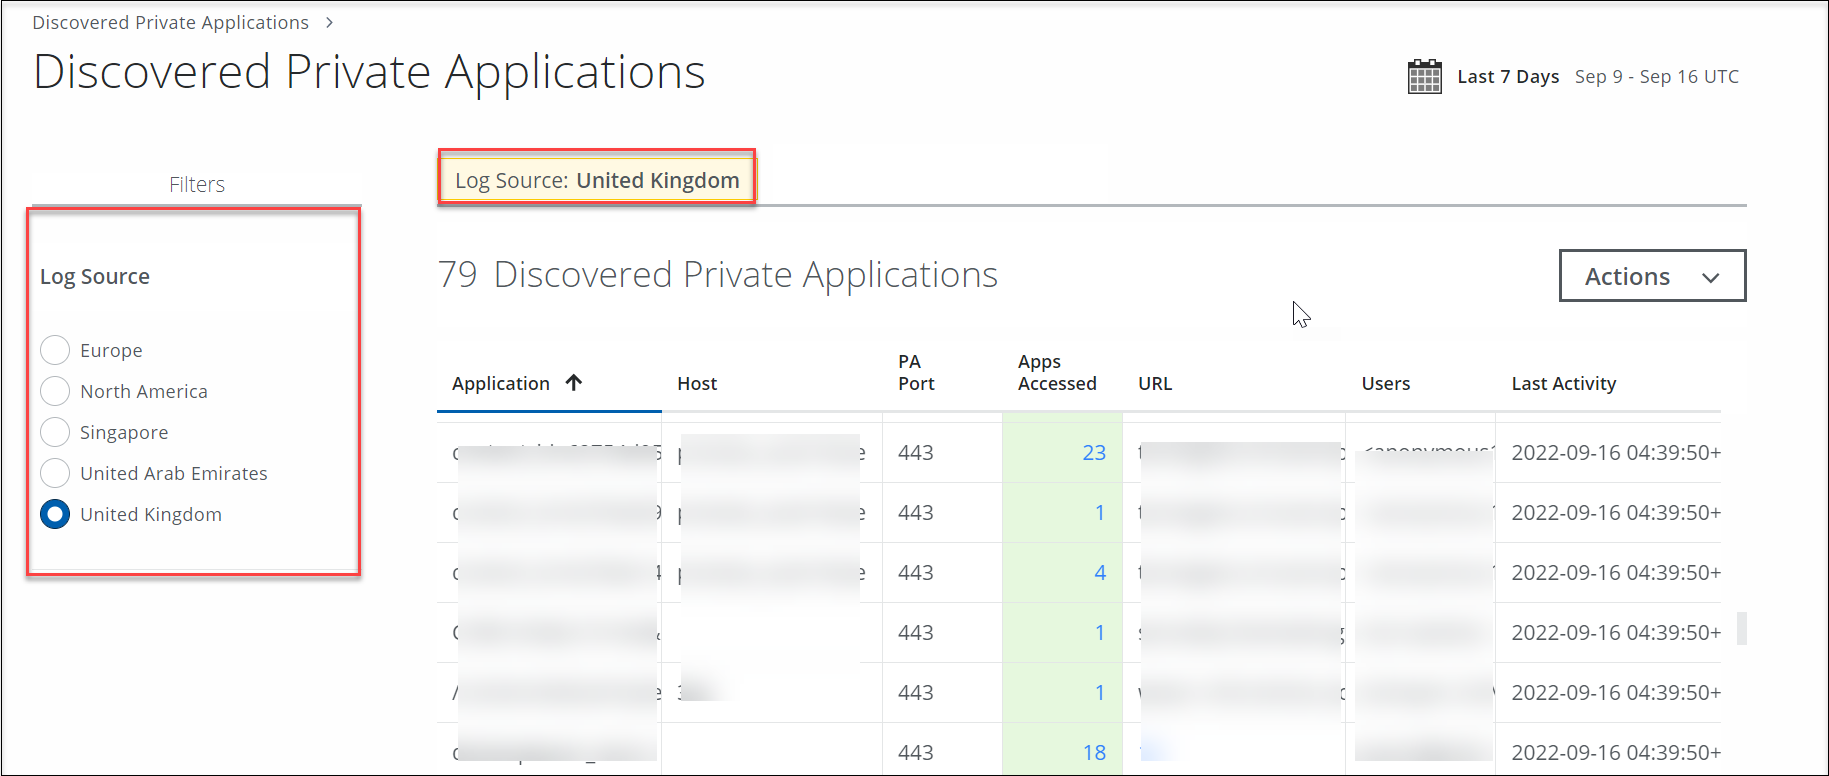
The Discovered Private Applications page provides the following information and actions:
- Filters. Select the data center location. You can select a log source to fetch the traffic information.
- Search. Use the Omnibar bar to search and view data that matches the criteria you specify.
- Date Picker. Use the Date Picker to select a preset or custom date range to display data from only this date range. Set this to UTC: Coordinated Universal Time.
- Actions.
- Create Report
- CSV. Create a CSV report and run it immediately, which then appears in the Report Manager.
- XLS. Create an XLS report and run it immediately, which then appears in the Report Manager.
- Schedule. Schedule a report to run later.
- Create Report
Table View
You can sort the following columns in ascending or descending order:
- Application. The name of the application.
- Host. The hostname of the application.
- PA Port. The port used to connect the application.
- Apps Accessed. The number of times the application is accessed.
- URL. Displays the URL of the application.
- Users. Displays the number of users establishing connections with the application.
- Last Activity. The timestamp of the last activity when the user accessed the application.
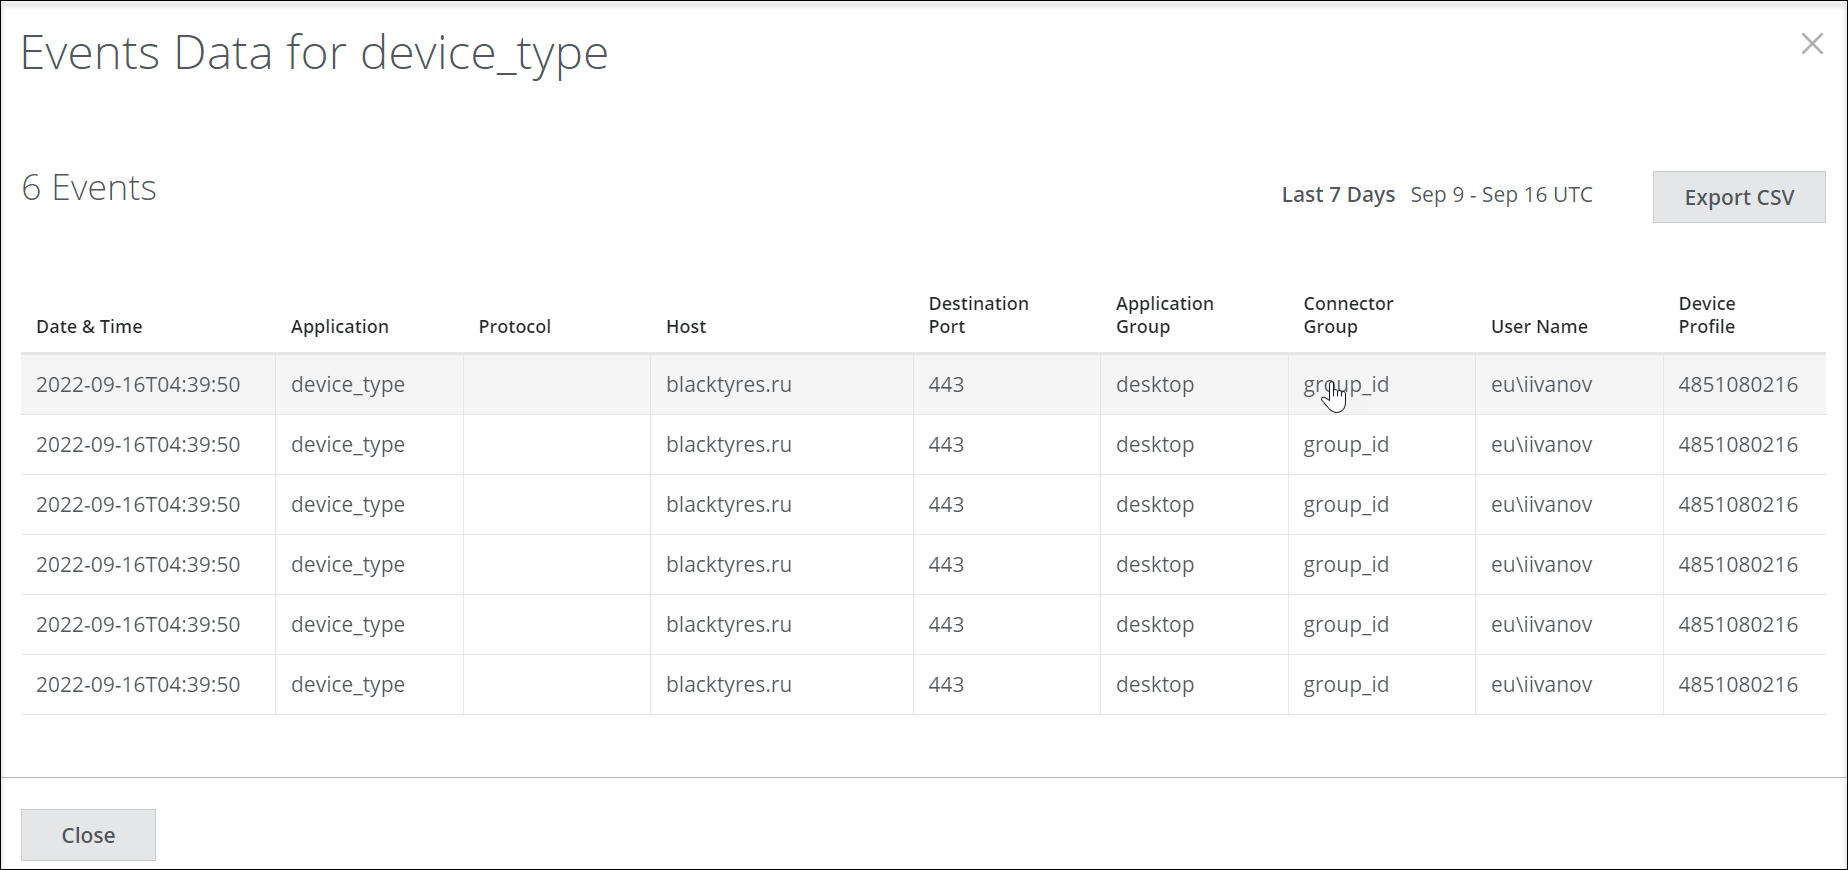
Events Data
The count shows the timestamp of the event, application name, host, number users, process name, Access/ Blok (Allow/ Block) and the firewall rule applied to the traffic. The traffic is blocked or allowed based on the rule applied.
- Export CSV. Click to export the information in this table to an XLSX file in CSV format.
- Close. Click to close the Events Data page.