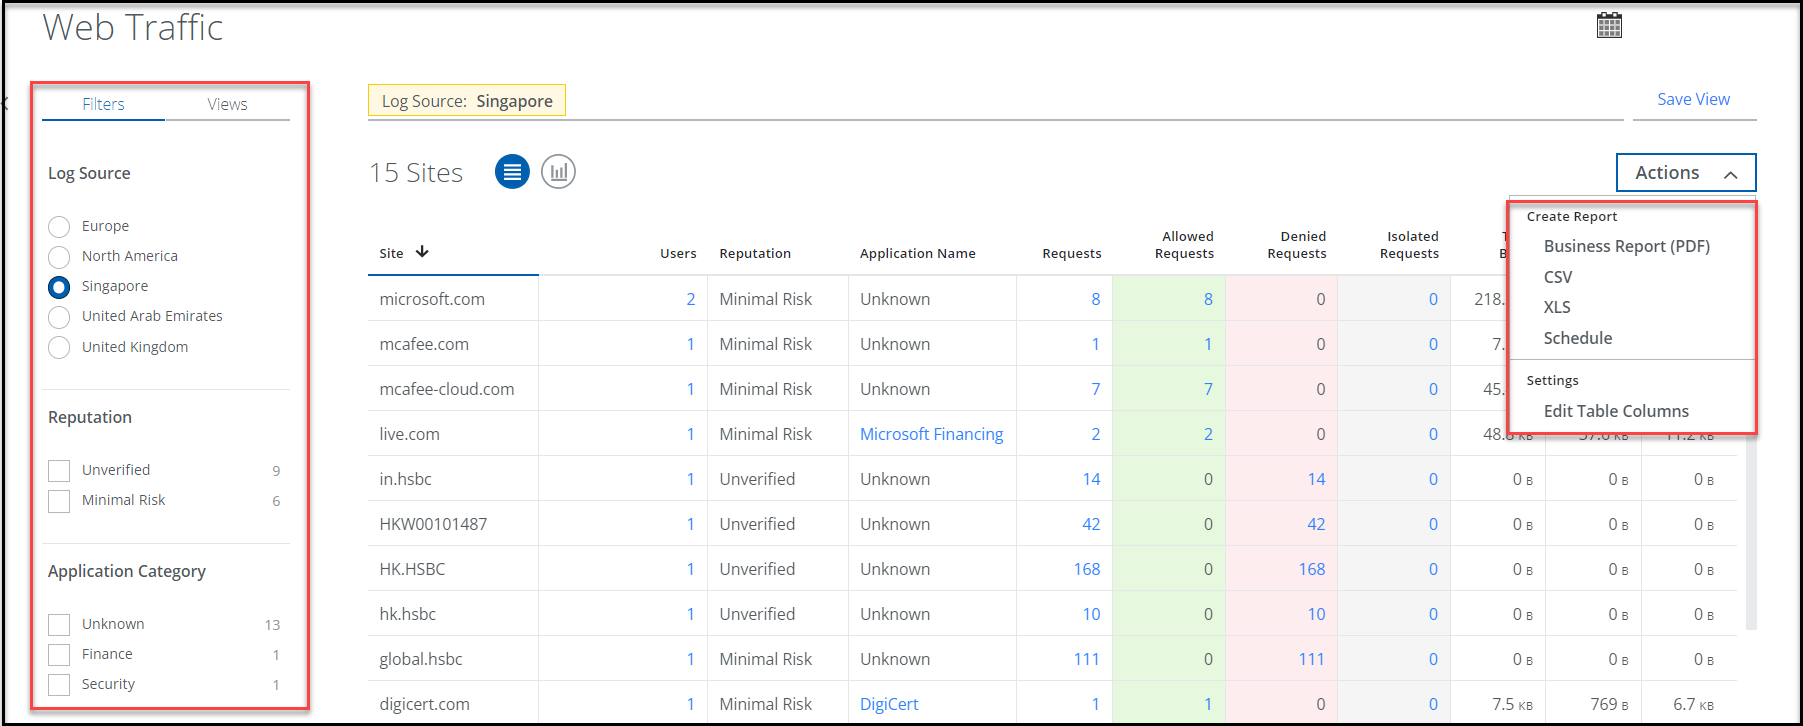
Web Traffic Page
The Web Traffic page provides a look at traffic data for your organization that can be sorted or filtered to suit your investigation or reporting.
You can view the aggregated traffic data by number of visits, website name, application name, number of requests (hits), allowed or denied requests, and number of bytes downloaded and uploaded. You can also view the traffic reputation (security risks) of a web traffic.
By default, it displays the data for the last seven days. You can use Date Picker to change the date range.
You can find the Web Traffic page under Analytics > Web > Web Traffic in Skyhigh CASB.
NOTE: In case of a database response issue, the service will try to recover from the issues and will report on previously fetched cached data. This is indicated by the message “The database did not respond quickly enough. Skyhigh Security Cloud is displaying data from cache for (date)."
Filtering Data on the Web Traffic Page
-
Log Source — Select a Log Source to fetch web traffic information from the selected data center location or locations.
-
Reputation — Displays whether visiting a site has a minimal, medium, or high risk, or whether the risk could not be verified.
-
Application Category — Choose an option to see web sites by the type of application, such as cloud storage or social media.
-
Action Taken — This filter shows web traffic that was either denied (meaning prevented from connecting) or allowed. You can adjust these filters in Web Policy.
-
Protection Area — This filter shows the reason for blocking the malware or allowing any site request along with the count.
-
Isolation Type — This filter shows the isolation type based on the applied RBI policy.
Sorting Data in the Web Traffic Page Columns
The columns in the Web Traffic page allow you to change how filtered data is displayed. For example, you can sort by site to organize by site name, or reputation to sort by web site risk.
You can customize tables by resizing columns, sorting the data, and selecting certain columns for display. If some of the columns are not applicable to your job, you can remove them from the page or resize them.
-
Site — Name of the website visited
-
Users — Number of users who accessed the site
-
Reputation — Reputation of a site
Displays whether the risk is minimal, medium, or high when visiting a site. -
Application Name — Name of the application
-
URL Category — Category of the site that is accessed through a URL
- Requests — Total number of hits
You can click on the value to view the complete list of events for the selected site. -
Allowed Requests — Number of allowed requests to connect to a site
-
Denied Requests — Number of denied requests that prevented connecting to a site
-
Total Bytes — Total number of bytes uploaded or downloaded from a site
-
Downloaded Bytes — Number of bytes downloaded from a site
-
Uploaded Bytes — Number of bytes uploaded to a site
-
Protection Area — Reason for blocking the malware or allowing any site request
-
Isolation Type — Isolation type based on the applied RBI policy
Creating Saved Views in the Web Traffic page
Once you've created a view of the data that helps you visualize data, you can save it as a View and reuse it to search data at any time. You can also create your own dashboard using this Saved View.
For more information please see Skyhigh CASB Saved Views.
Exporting data or reports from the Web Traffic page
It's important to share data reports to get as much use out of the data found in the Web Traffic page. You can share the information via exporting it (a few different file formats are supported) or in a PDF report.
If you choose to use PDF reports, you can actually schedule the report to run and automatically send a PDF to coworkers you choose. You can find more information in Set up Reports and Scheduled Reports.
Once you've identified a dataset that you would like to export, you can export the displayed data to a CSV, XLS, or PDF file. Those options are in the Actions menu.