Web Dashboard
The Web Dashboard provides a summary of web malware and web traffic activities. By default, it displays the data for the last 7 days. The dashboard provides easy and quick access to top web requests and trends.
You can find the Web Dashboard under Dashboards > Web Dashboards.
For more information about working with Dashboards, see My Dashboard.
Default Web Dashboard cards
- Top Blocked Web Malware — Displays the malware name and the corresponding number of requests that were blocked in the last 7 days.
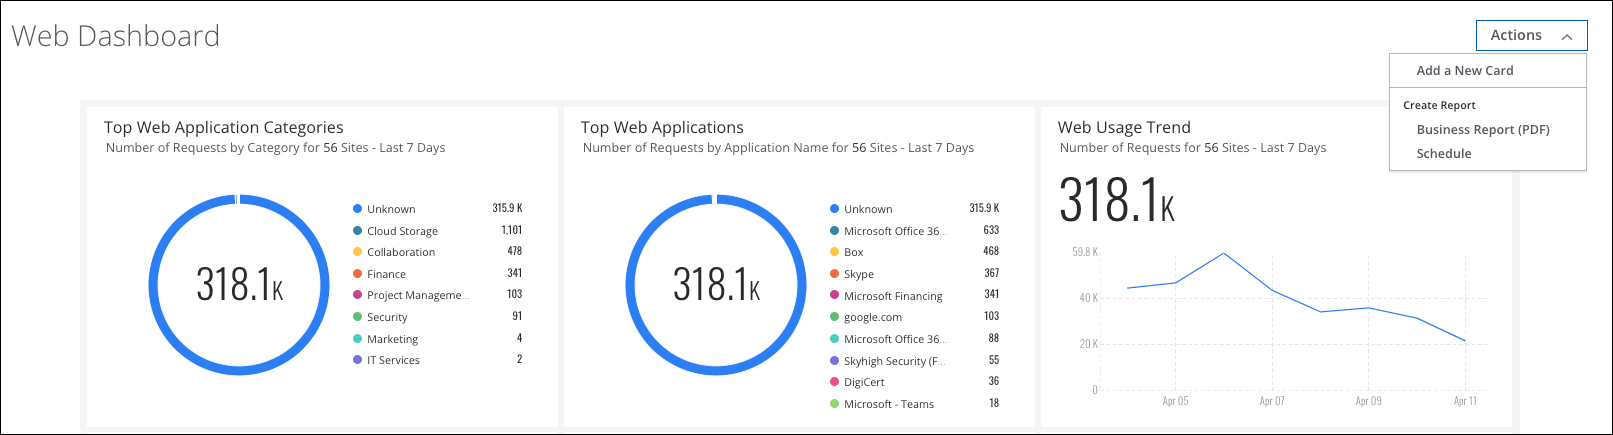
- Web Usage Trend — Displays the number of requests in the last 7 days.
- Top Web Applications — Displays the number of requests grouped by applications in the last 7 days.
- Top Web Application Categories — Displays the number of requests grouped by application categories in the last 7 days.
- Top Web Client IP with Malware Detected — Displays the number of requests by client IP addresses who have accessed the malware in the last 7 days.
- Top Web Users with Malware Detected — Displays the number of requests by users who have accessed malware in the last 7 days.