Troubleshooting with Rule Engine Tracing
What is Rule Engine Tracing?
Rule Engine Tracing is a visual representation that a request, response, and embedded cycles take through your policy. Rule Tracing Central was designed to make debugging your rules easy, help you understand the flow a web request takes through the rule engine, and save you time!
Have you ever needed to find out why a site was getting blocked or why your allowlist isn't working correctly? Did you ever have to figure out why a user was not assigned to the correct rules in your Policy? Rule Engine Tracing will help you solve all of these problems.
In this document you will gain a basic understanding of the Rule Engine Tracing user interface, along with how to use the feature to troubleshoot issues.
Rule Engine Tracing UI Overview
The easiest way to demonstrate the power of Rule Engine Tracing is with an example.
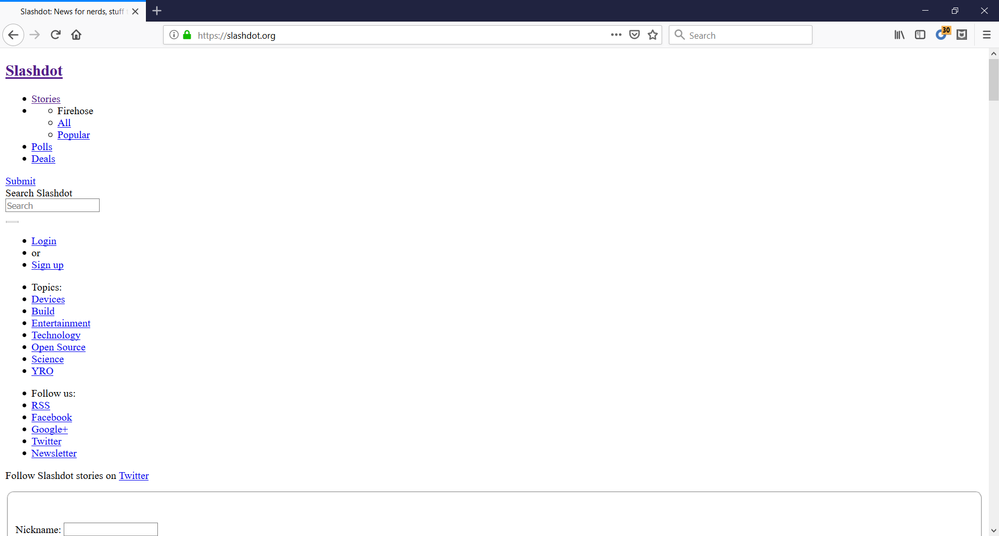
Example 1: A website loads but without images -only text is displayed
A user browses to slashdot.org while going through the Secure Web Gateway. The page loads, but it does not have any images and only text is being displayed. It looks like the image below.
Let's reproduce the problem while using Rule Tracing Central. In the Secure Web Gateway UI, go to the Troubleshooting > Rule Tracing Central section. Use the screenshot below to follow along.
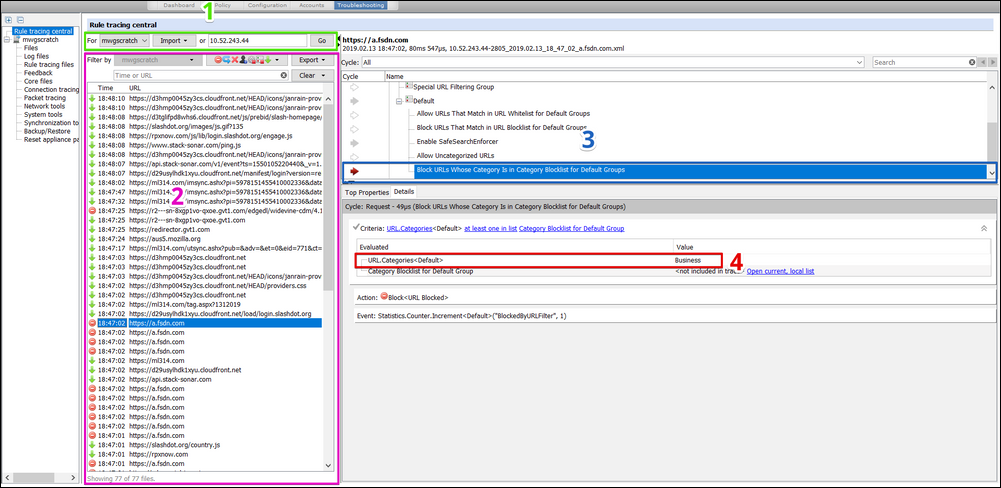
- Trace your client: Enter the client IP from where you’ll replicate the issue above. If you use Central Management, be sure to select the Secure Web Gateway appliance through which the client traffic will be proxied. Click ‘Go’ to start tracing. On your client machine, refresh your browser to replicate the issue. As your client's requests hit the Secure Web Gateway, trace files will appear in the Traces pane (section 2). Note: Sometimes it can take a while before traces show up, especially on larger transactions---be patient. Stop the trace after the issue was replicated.
- Select the trace file: On the left-hand side, icons indicate the action that was taken for each request captured. These icons are the same icons that are used for the block, continue, authenticate, redirect, stop rule set, stop cycle, and remove actions in your Secure Web Gateway policy.
In this example, you can see that several requests for a.fsdn.com are being blocked. Most likely these are from a content server for Slashdot. Click on one of the blocked traces to populate the right-side panes and find out why it is being blocked. - Analyze trace result: The upper right-hand pane is populated with a tree view of your Secure Web Gateway's policy. The view automatically jumps to the last action that was executed for this particular request. In our example, that was a block action on the rule named "Block URLs Whose Category is in Category Block List for Default Groups".
- Expand Details: The Details tab allows you to see evaluated properties, actions, and events associated with the selected rule. In this example, we see the requests fora.fsdn.com were blocked as “Business” because this category is in the “CategoryBlocklist”.
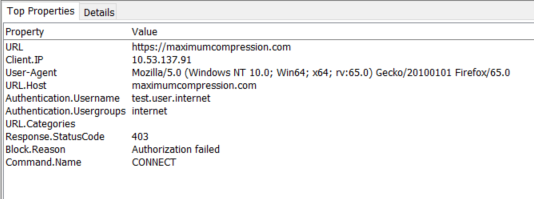
The Top Properties tab can also give you useful debugging information regarding a specific web request. In the example below, you can quickly identify the URL, URL.Host, and URL.Categories properties for allowlisting purposes.
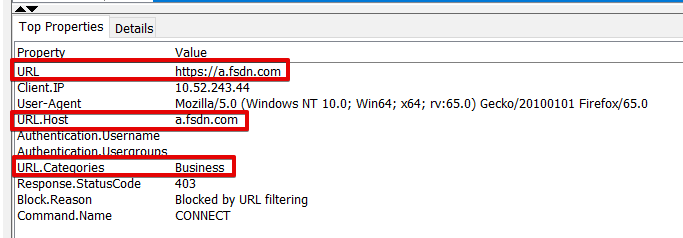
Summary: Rule Engine Tracing quickly showed us that the Host, a.fsdn.com, is being blocked by the rule "Block URLs whose Category is in Category Blocklist for Default Groups" because its category "Business" is in the list "Category Blocklist". To resolve the issue, you can create an allowlist rule by using the information contained in the Top Properties or Details tab.
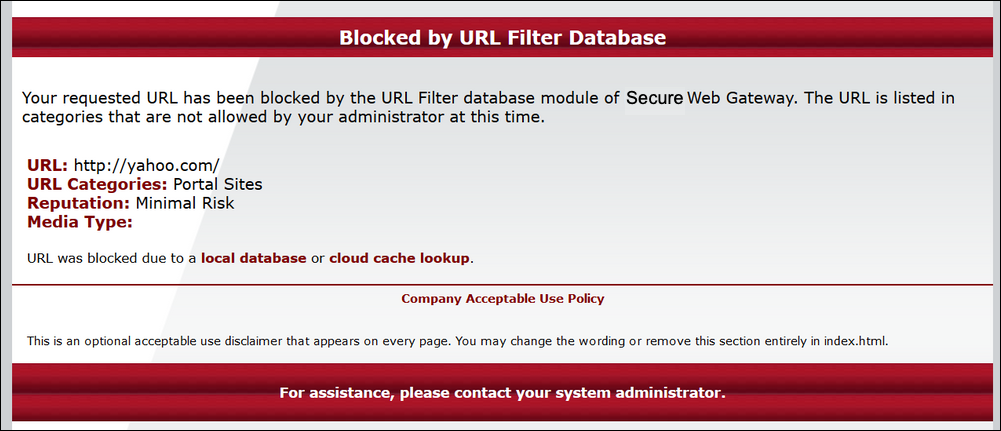
Example 2: User Group policy not applied as expected
A user receives an unexpected block page when attempting to access www.yahoo.com.The user should have been allowed access based on the expected policy assignment. The user is supposed to be assigned the policy contained in the rule set "URL Filtering-> Special URL Filtering Group" because they are a member of the "VIP" group.
Let's reproduce the problem while using Rule Tracing Central. In the Secure Web Gateway UI, go to the Troubleshooting > Rule Tracing Central section. Use the screenshot below to follow along.
- Trace your client: Enter the client IP from where you’ll replicate the issue above. If you use Central Management, be sure to select the Secure Web Gateway appliance through which the client traffic will be proxied. Click ‘Go’ to start tracing. On your client machine, refresh your browser to replicate the issue. As your client's requests hit the Secure Web Gateway, trace files will appear in the Traces pane (section 2). Note: Sometimes it can take a while before traces show up, especially on larger transactions---be patient. Stop the trace after the issue was replicated.
- Select the trace file: On the left-hand side, icons indicate the action that was taken for each request captured. These icons are the same icons that are used for the block, continue, authenticate, redirect, stop rule set, stop cycle, and remove actions in your Secure Web Gateway policy.
- Analyze trace result: The upper right-hand pane is populated with a tree view of your Secure Web Gateway's policy. The view automatically jumps to the last action that was executed for this particular request. In our example that was a block action in the rule"Block URLs Whose Category is in Category Blocklist for Default Groups" inside of the ruleset "URL Filtering->Default".
- Expand Details: The Details tab allows you to see evaluated properties, actions, and events associated with the selected rule. In this example, we see the requests for www.yahoo.com were blocked as "Portal Sites" because this category is in the"Category Blocklist".
The results we found were unexpected, as the client's request should have reached the "URL Filtering->Special URL Filtering Group" ruleset as opposed to the "URL Filtering-> Default" ruleset -- which restricted access to this site. Next, we'll want to focus our attention to the "URL Filtering-> Special URL Filtering Group" ruleset to figure out why the request did not match its criteria. Use the screenshot below to follow along.
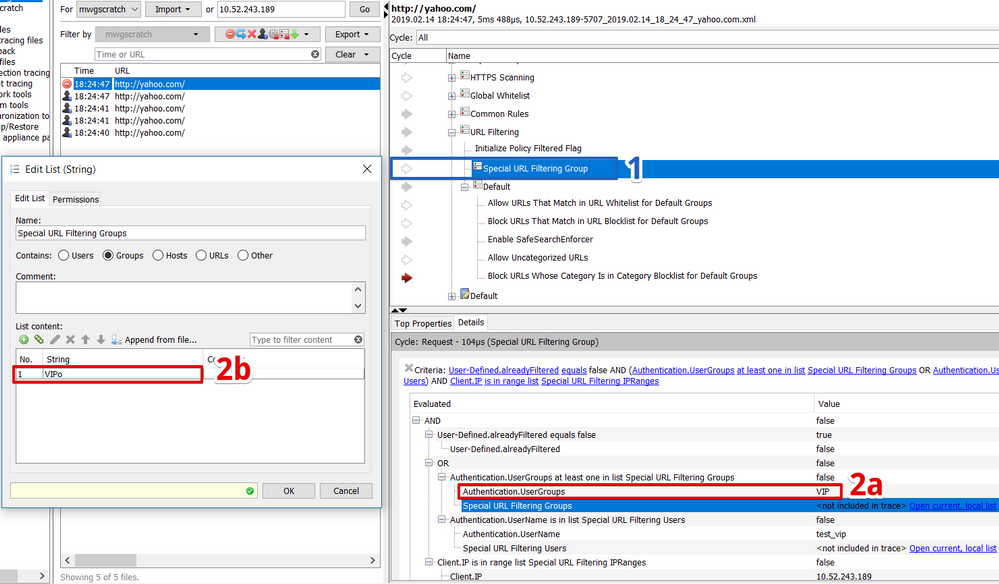
- Select the "URL Filtering-> Special URL Filtering Group" ruleset: Note that the arrow next to the ruleset is hollow. This indicates that the request did not match the criteria to go inside of that ruleset.
- Analyze Criteria: Focus on the 'Details' pane to analyze the criteria.
- Criteria: This is the criteria you've added for the request to enter the ruleset. According to your rules, a user must be a member of a group in the list "Special URL Filtering Groups". ("Authentication.UserGroups at least one in list "Special URLFiltering Groups")
- Evaluated Criteria: This is the result of the evaluation for the Authentication.UserGroups part of the criteria. The user is part of the "VIP" group; but, this group is apparently not in the list "Special URL Filtering Groups".
- Open List: We expected this list to contain "VIP", so let's click on "Open current, local list" to quickly review its contents. We see that the list contains the"VIPo" group -- indicating that the admin entered a typo into the criteria---whoops!!.
Summary: Rule Engine Tracing quickly showed us that the user's request didn't match the expected "VIP" rule due to a typo in one of the lists on the Secure Web Gateway. The easy solution is to update the list to match the actual group name.
Example 3: Getting blocked by embedded content unexpectedly
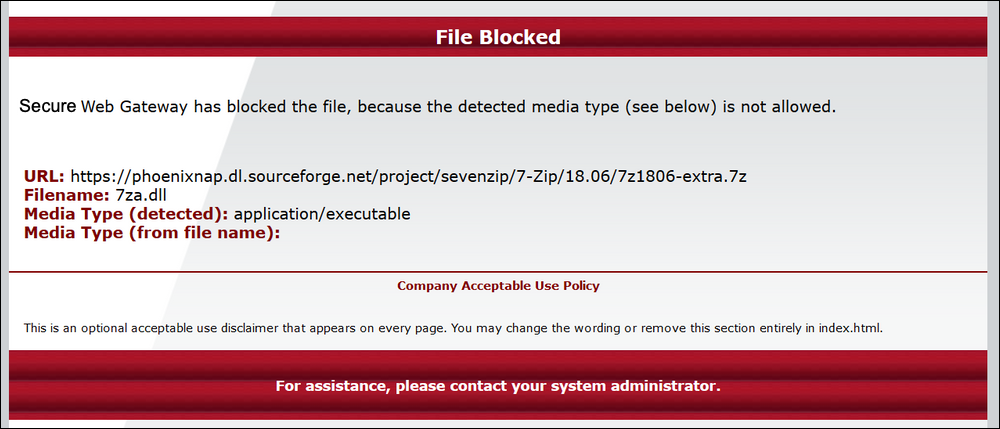
A user receives an unexpected block page when attempting to download a zip file. The administrator expected the zip file to download, as they do not block zip files in their Media Type Blocklist rule.
Let's reproduce the problem while using Rule Tracing Central. In the Secure Web Gateway UI, go to the Troubleshooting > Rule Tracing Central section. Use the screenshot below to follow along.
- Trace your client: Enter the client IP from where you’ll replicate the issue above. If using Central Management, be sure to select the Secure Web Gateway appliance through which the client traffic will be proxied. Click ‘Go’ to start tracing. On your client machine, refresh your browser to replicate the issue. As your client's requests hit the Secure Web Gateway, trace files will appear in the Traces pane (section 2). Note: Sometimes it can take a while before traces show up, especially on larger transactions---be patient. Stop the trace after the issue was replicated.
- Select the trace file: On the left-hand side, icons indicate the action that was taken for each request captured. In this example, we know that we were blocked, so we select the trace file associated with the 'block' icon.
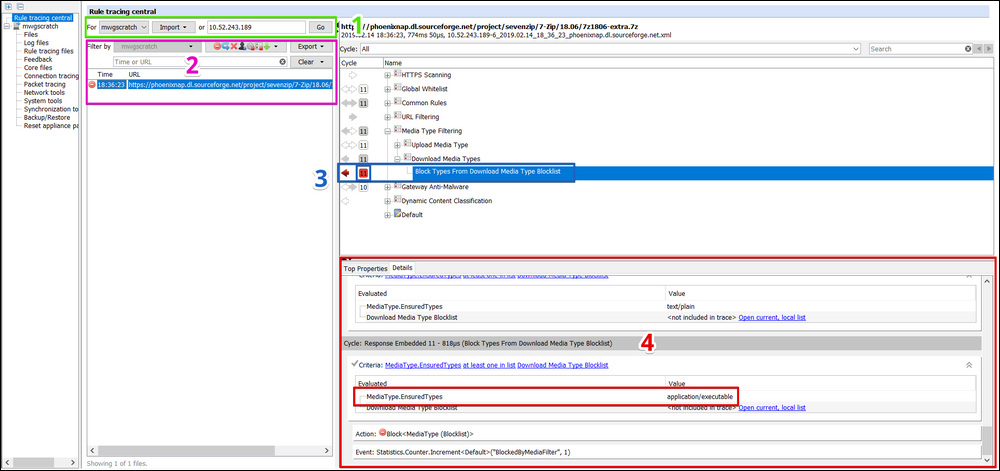
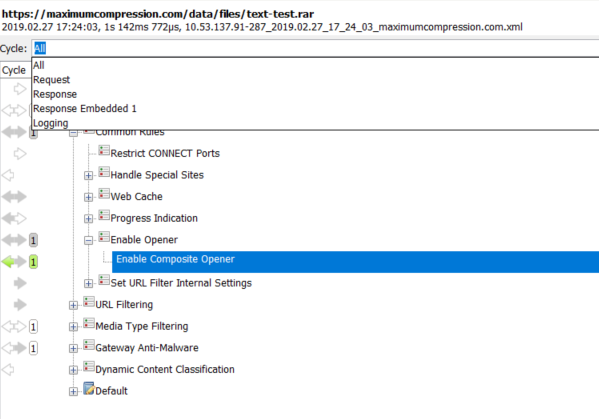
- Analyze trace result: The upper right-hand pane gets populated with your Secure Web Gateway policy tree view. The view automatically jumps to the last action that was executed for this particular request. In this example, that was a block action on the rule named "Block Types from Download Media Type Blocklist".
Notice the highlighted red arrow pointing to the left and the number '11' in the filled rectangle. This indicates:
- The request was blocked in the response's embedded cycle.
- The composite opener is enabled in the policy/rules. Calling the composite opener causes the Secure Web Gateway to start extracting the Zip file - sending all archive members as individual embedded cycles through the rule engine.
- The '11' indicates that eleven embedded cycles were processed before the block action was triggered.
- Expand Details: The Details tab allows you to see evaluated properties, actions, and events associated with the selected rule. Let's focus on why this rule is blocking the download of the zip file. In this example, you can see that several archive members of the zip file were extracted and sent as embedded cycles through the rule engine.
Response embedded 11, at the bottom of the details area, shows that the Media Type Filtering rules detects the final scanned archive member as 'application/executable'. Notice the grey check-mark next to the Criteria in this cycle. This indicates that the criteria evaluated to a true statement and a block action was applied.
Summary: Rule Engine tracing showed us that it was an embedded file inside the zip file that triggered the block page. Secure Web Gateway's composite opener extracted the zip file and sent all of the archive members to the rule engine for inspection. One of the archive members was an executable, which was a media type that this Administrator was blocking. If this particular download was needed, the Administrator could add an allowlist entry for this particular URL.
Additional Information
Top Properties
The Top Properties tab can show an administrator very useful debug information. This section shows a very clean view of the most commonly used properties and their values for each web request. The top properties can be a benefit for troubleshooting issues and for building rules in your policy.
For instance, if you wanted to apply a rule based on the client's User-Agent, you're very quickly able to see what User-Agent the client is using.
Another example could be that you're looking to allowlist a specific URL.Host, but you're not sure exactly what value is filled for that property. The Top properties is the quickest means to find that information. Use the Top Properties instead of sifting through your access log or through a wireshark trace.
Cycles
The cycles pane is useful when you are trying to figure out when a rule or ruleset was processed and the outcome of the rule. Cycles are represented by arrows in different colors. The meanings of each arrow are as follows:
- Arrow pointing to the right -- Request Cycle
- Arrow pointing to the left -- Response Cycle
- No arrow pointing to the right(left) -- No processing in request(response) cycle.
- Hollow Arrow -- Rule or Rule Set was processed but the criteria was not matched.No Action/Event took place.
- Gray Arrow -- Action executed, but not as the most impacting action.
- Green Arrow -- Stop Rule Set, Stop Cycle, or Continue executed as the most impacting action in trace.
- Yellow Arrow -- Remove executed as most impacting.
- Blue Arrow -- Authenticate executed as most impacting.
- Dark Green Arrow -- Redirect executed as most impacting.
- Red Arrow -- Block executed as most impacting.
Below are a few examples of each cycle that we can look into to get further information. For this example, we will examine the processing of a text file inside of an archive file. When we first select the trace it will have all of the cycles selected. We can use the dropdown bar to dig deeper into each cycle.
Link to List
The Link to List feature will allow you to modify list entries in your policy. This allows the administrator to both troubleshoot and fix your problem within the Rule Tracing Central interface.
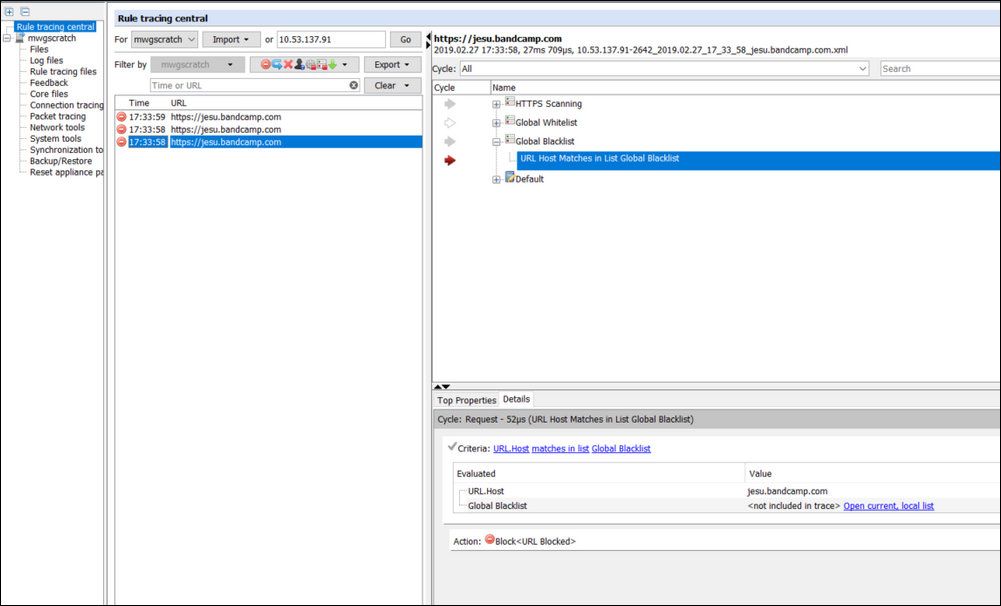
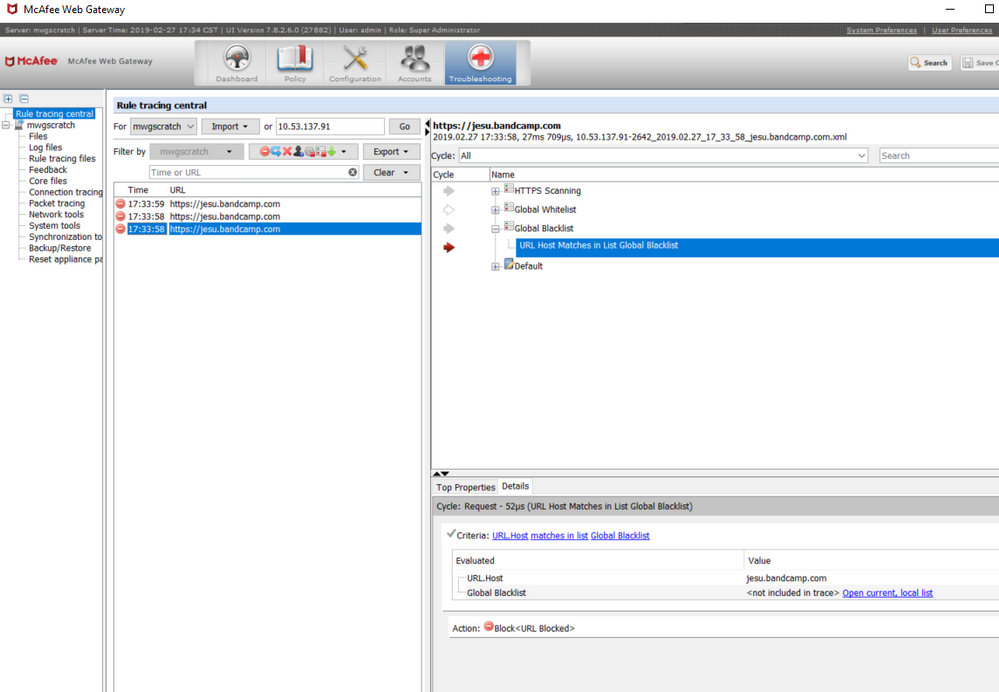
Let's assume your block for a specific URL is not functioning, below is an example of how the Link to List can be used to quickly resolve issues.
Our rule to block this URL is: URL (is in list) "Global Blocklist". Currently, there is just the one entry in the list:
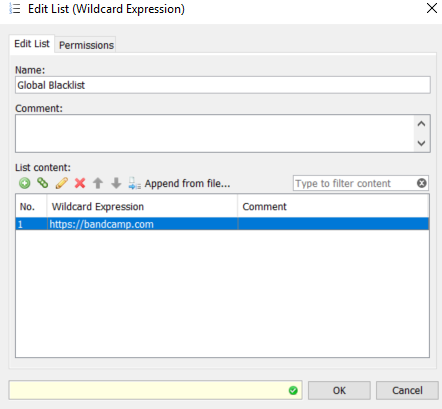
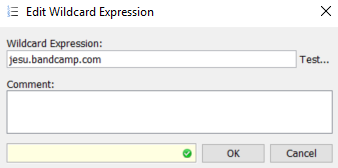
We can see here that the URL being requested is not "bandcamp.com" but"jesu.bandcamp.com". To correct the list entry click the link to "Open current, local list".this will open the Edit List (String) window:
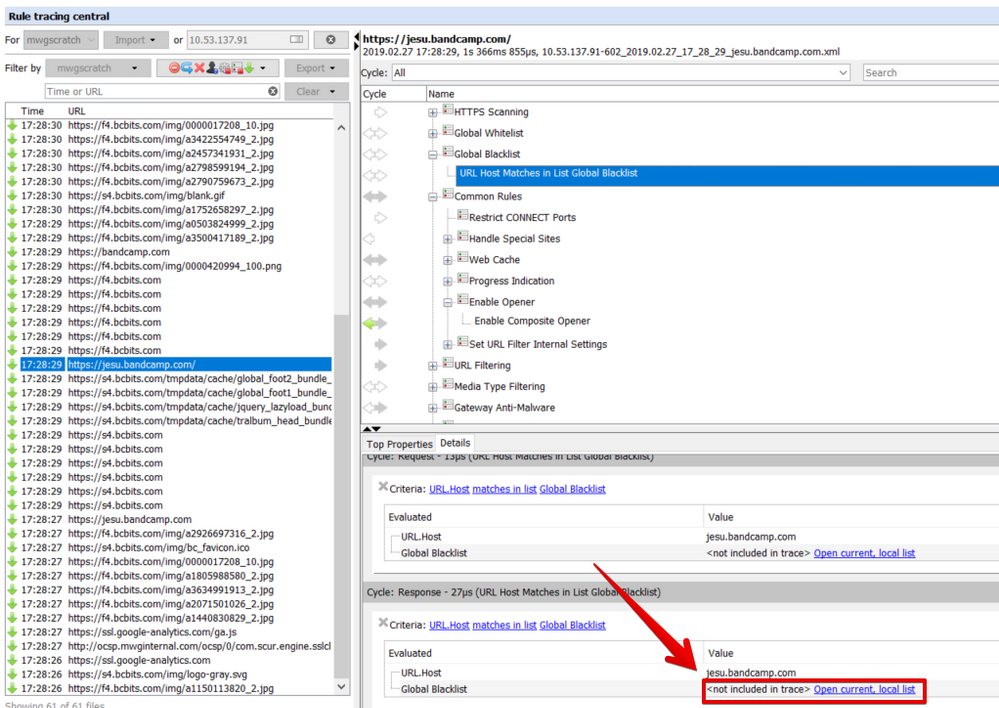
You can now proceed to change the entry from bandcamp.com tojesu.bandcamp.com. Once the edit is complete Save Changes and test again.

Another rule trace shows the URL requested being blocked as desired.
Filters
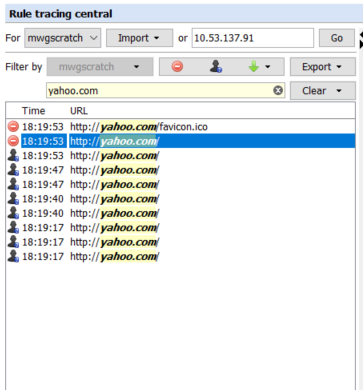
With the Rule Tracing Central, we can also filter the traces down to find the exact ones we are looking for. Below is an image of the available filters.
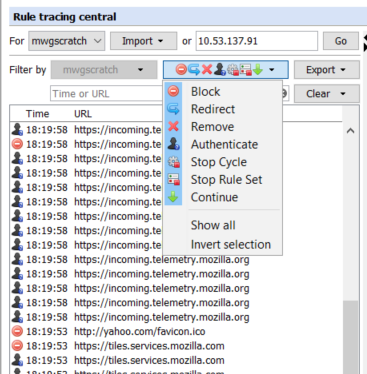
We can use these filters to find exact traces. For example, I want to see traces which major actions are either Block, Authenticate, or Continue and contains yahoo.com in the URL.
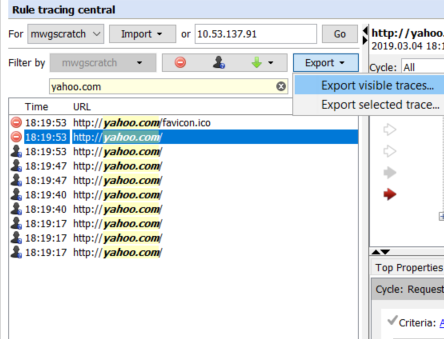
Import/Export
Rule Tracing Central also features the ability to import and export rule traces from the GUI. When you export selected/visible traces, you will be able to save them in a zip archive. This can prove useful for storing old traces or to submit traces to Skyhigh Support. You can also import traces from other Secure Web Gateways or from prior troubleshooting attempts.
Deleting Rule traces
Rule engine traces can be removed from the panes of Rule Tracing Central, but they still exist on the file system of the appliance. To delete the rule traces from the file system you need to access the "Rule tracing files" section, which can be found under the <appliancehostname> sections of the Troubleshooting menu.
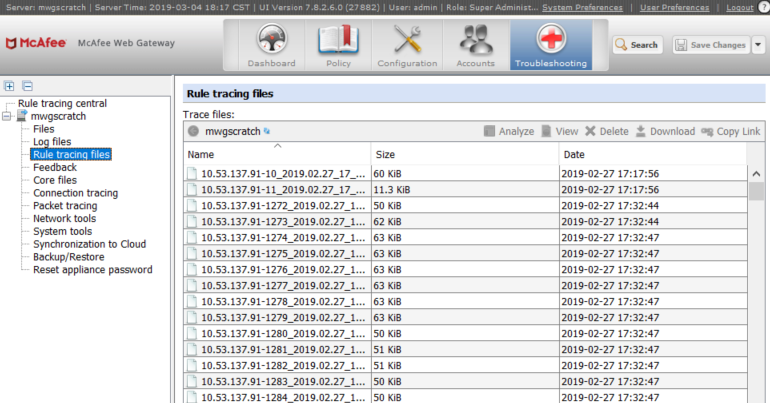
If you leave rule engine tracing on by accident, there is no need to worry about the appliance's disk filling up; the Secure Web Gateway only stores up to 5000 traces. When the Secure Web Gateway goes over that number, it begins deleting the oldest traces. This deletion is not reflected in the Rule Engine UI, so you might see some old entries which you cannot access because they have been deleted.