Understand Page Views
Introduction
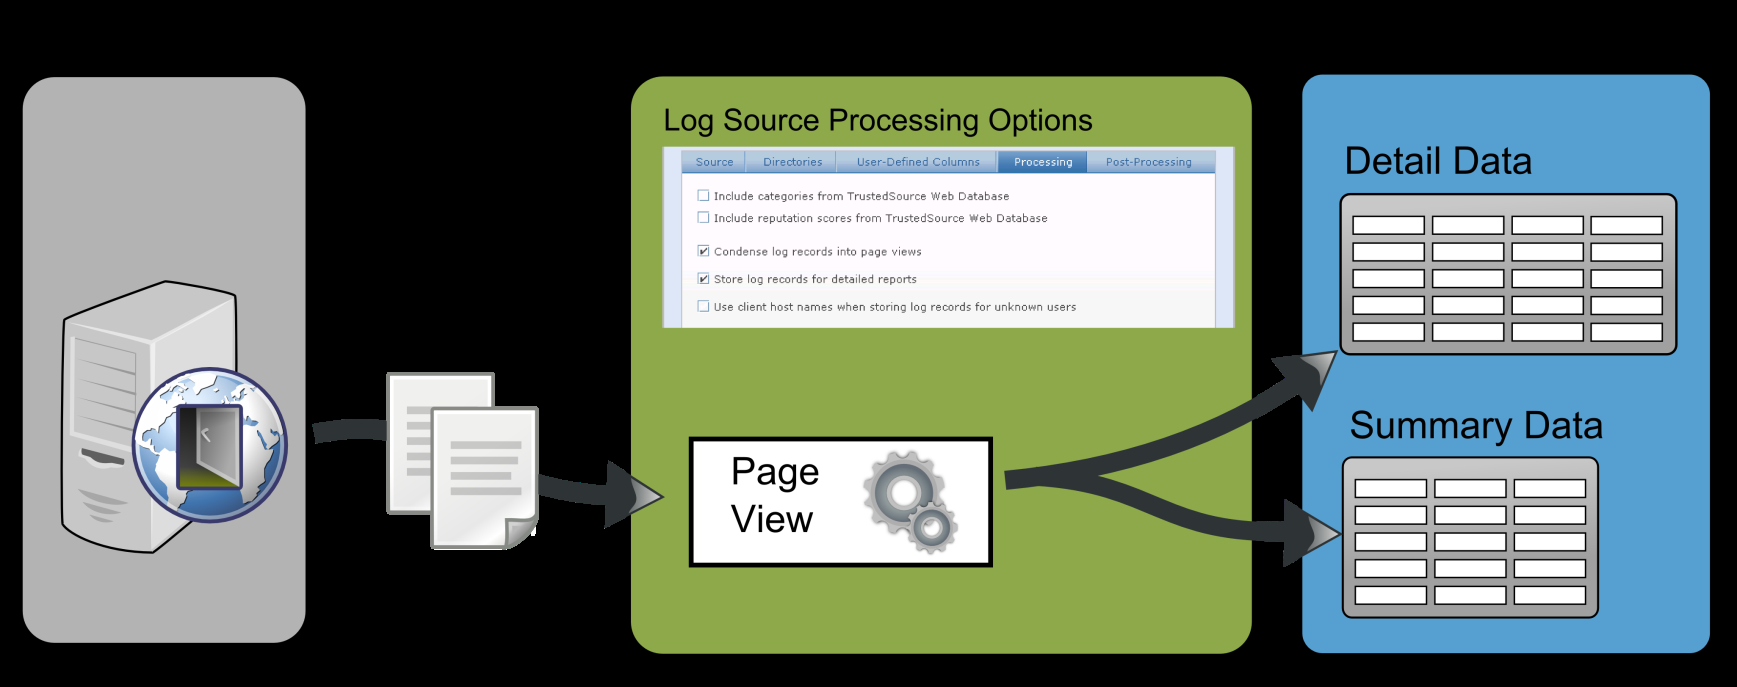
Most web pages today consist of more than a single HTML document. It is common for HTML documents to include additional content such as images, style sheets, and java scripts. What you see in the web browser appears to be a single document, but in reality the web browser is fetching each piece of the web page separately and assembling them into what is casually thought of as a webpage. From a networking perspective, the client didn’t request a single file,but rather several files, possibly from different websites. All of these requests are written to access logs by the web proxy, such as Skyhigh Security Web Gateway. Web Reporter processes these logs and uses the data to make reports. Depending on the processing options chosen, such as page views, the results in the reports can be quite different.
This document attempts to illustrate the page view calculations and how they affect reports using a real world example.
Data Sets
Web Reporter has two data sets that represent the same data. The summary data set provides an overview of web traffic with the advantage of high performance. For example, summary data contains the host name, date, and hour, but not the full URL or the exact second the request was made. But reports on summary data run much faster and also include browse time.
As a contrast to summary data, the detail dataset has the exact URL and the exact time it was requested. The big disadvantage for detail data is that it does not contain the browse time and reports generally run slower due to the increased size in data. Detail data is stored by default,but can be disabled if not wanted, but the summary data is always kept.
How Page Views Are Calculated
Page views are often confused with summary data, but it’s actually a pre-processing option performed on the access logs during log parsing before the data is stored as summary or detail data. The goal of page views is to remove requests for content embedded into a webpage, and only show the web pages users are visiting. This is done by looking for pauses between requests based on the access logs. If there is more than 2 seconds requests, a new page is started. The exception is that only allowed requests are rolled into a page view. Requests that are blocked or for which the client was warned are always excluded from the page view.
Example
For this example, We opened my web browser and went to www.skyhighsecurity.com, paused for 30 seconds, then went to www.youtube.com.
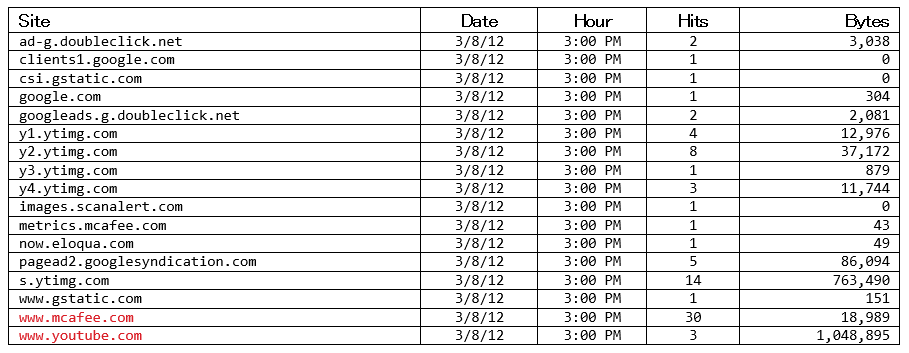
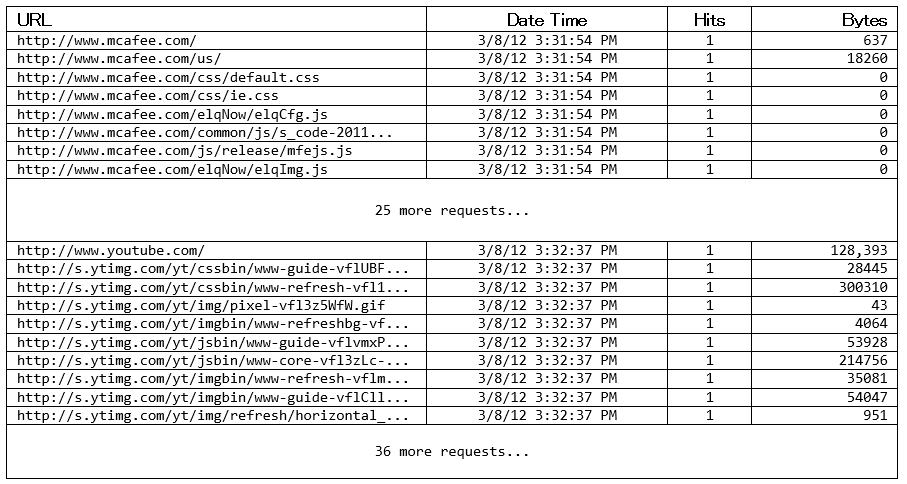
The two tables below represent the test data without page views enabled. You can see a large list of requests that were made by the browser to create the web pages. The summary table has 17 different sites, and the detail table has 79 requests total for 2 web pages. You may notice that the summary table shows several hits to www.skyhighsecurity.com, but this is not a mistake.The browser made several requests to the site to download images and other page content, so there are multiple hits registered to www.skyhighsecurity.com. You can clearly see those requests if you look at the URLs in the detail table. It is worth mentioning that the 0 bytes means the client’s local cache was used, and therefore no bytes were sent to the client.
Summary Data (Without Page Views)
Detailed Data (Without Page Views)
The next two tables illustrate the result of page views by using the exact same log fi le. As you should expect with page views enabled, the reports only have two requests. Notice that hits for www.skyhighsecurity.com and www.youtube.com are much more aligned with what the user did. But just as important, 79 total requests to 17 different sites have been reduced to just 2 requests, for a compression factor of nearly 40:1. Typically the average page view for all web traffic is between 10:1 and 15:1.
Summary Data (With Page Views)

Detailed Data (With Page Views)
